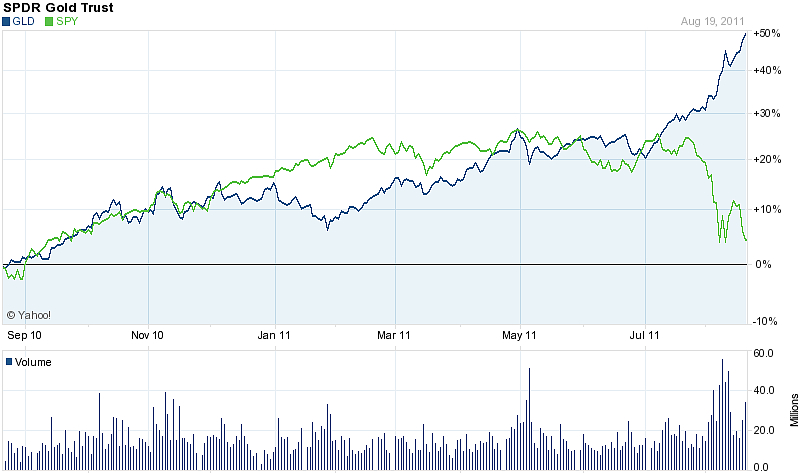
GLD vs. SPY Relative Price
click for larger graphic

Source: Solari Report, Yahoo Finance
>
Here is an interesting observation: The value of the SPDR Gold Trust (GLD) is now worth more than the SPDR S&P 500 (SPY) representing the full index. (This refers to the ETFs and not the underlying value of the SPX and Gold).
Note that ETFs are not fully representative of the underlying indices valuation, and that can lead to some odd permutations. For example, Apple (AAPL), a member of the S&P500 Index (SPY) and Nasdaq100 (QQQ), is worth more than both ETFs combined.
Back to Gold: State Street Global Advisors, which administers the ETFs, puts the value of Gold ETF at $76,673.81M versus the S&P 500 ETF at $74,381.35 M.
~~~
What might this mean?
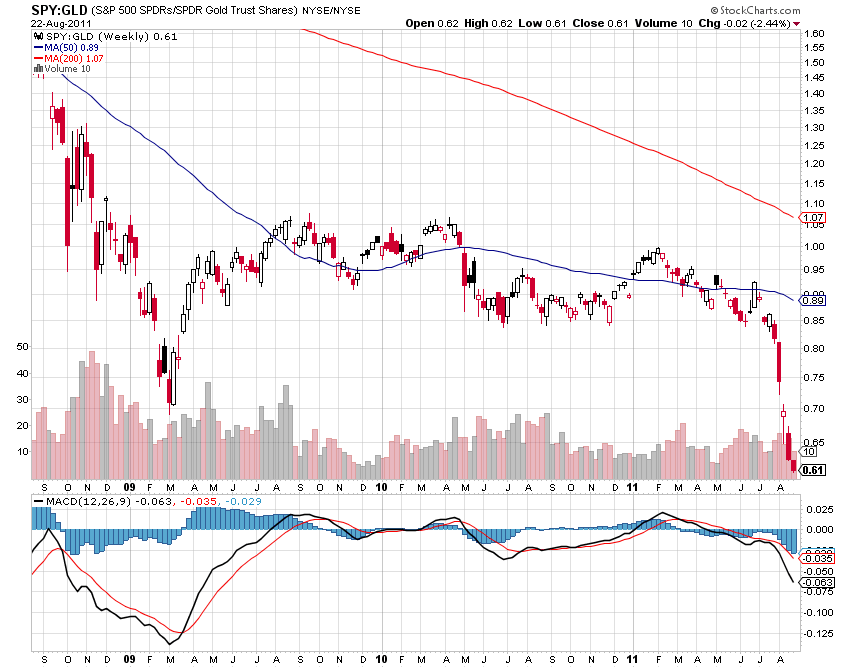
Lets look at the two charts on this page: The one at top shows the relative moves of the two indices. They have diverged, heading in separate directions, and are now extremely far apart. That valuation difference is reflective of sentiment reaching an extreme. This is somewhat reminiscent of back in October 2002, when the Pimco Total Return Bond Fund surpassed the Vanguard S&P500 fund to become the largest mutual fund (See these Contrary Indicators 2000 – 2003 Bear), and could have some contrary value.
The second chart, at bottom, shows a simple ratio of SPY to GLD. It has now dropped below the March 2009 levels. That might also be constructive for a reversion (ie, bounce in SPY and drop in GLD)
It could be a contrary indicator, as the two indices have moved to extremes. Equity markets are now extremely oversold, while Gold has moved parabolically. Some mean reversion would appropriate around now.
One caveat: The MACD reading of this ratio was far more deeply into the red back at the 2009 market lows. That suggests this reading can get further oversold.
Perhaps this is supportive of (warning: selective perception ahead) an oversold bounce that ultimately rolls over, taking this ratio to greater extremes.
>
SPY versus GLD Ratio
Source: StockCharts


What's been said:
Discussions found on the web: