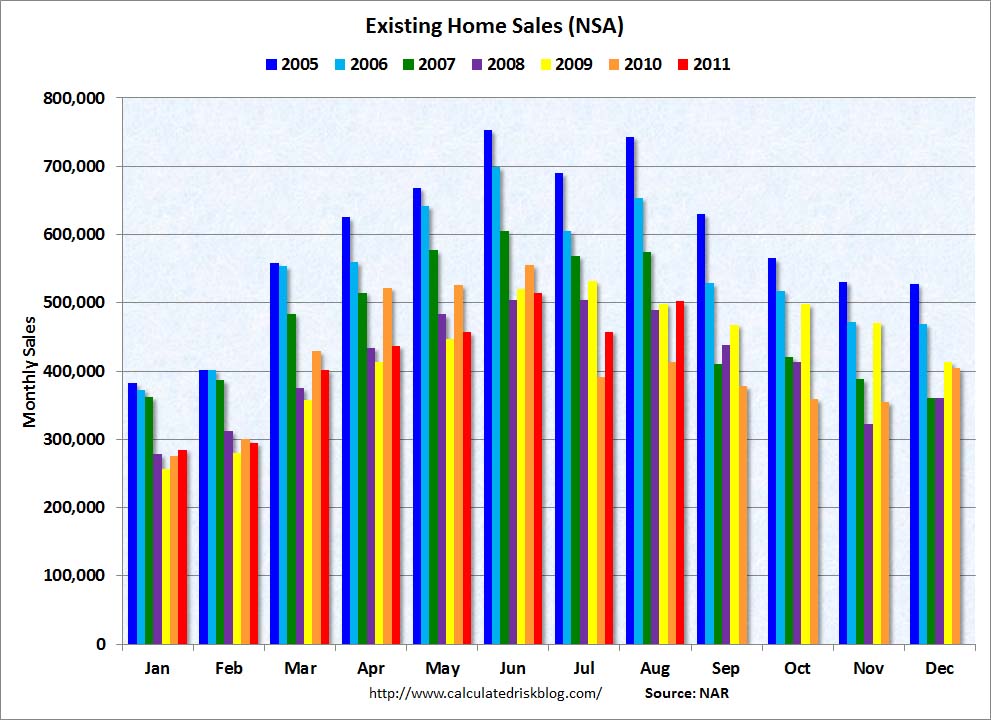
Chart courtesy of Calculated Risk
>
Above you will find our favorite housing chart — Existing Home Sales, but raw non seasonally-adjusted data. As you can see, the August 2011 is an improvement from 2010, but about onm par with ’08 and ’09.
Here is the usual NAR happy talk:
“Existing-home sales increased in August, even with ongoing tight credit and appraisal problems, along with regional disruptions created by Hurricane Irene, according to the National Association of Realtors. Monthly gains were seen in all regions.
Hurricane Irene? Really? Let’s skip the babbling nonsense, and go to the data:
• Total existing-home sales rose 7.7% in August; That is a seasonally adjusted annual rate of 5.03 million sales
• Year over year, that reflects an 18.6% increase than the 4.24 million vs August 2010.
• National median existing-home price was $168,300 — a fall of 5.1% versus August 2010
• First-time buyers were about 32% of EHS
• Investors are 22% of purchase activity vs 18% in July and 21% in August 2010.
• All-cash sales were 29% of transactions in August, similar to last month and August 2010;
• Distressed homes were 31% of all sales, vs 29% in July and 34% in August 2010.
• Contract failures were 18% in August.
• Total housing inventory fell 3.0% to 3.58 million existing homes available for sale (8.5-month supply)
My best guess is we are about halfway through the process of working off the housing excesses.
>
Source:
August Existing-Home Sales Rise Despite Headwinds, Up Strongly from a Year Ago
National Association of Realtors, September 21, 2011
http://www.realtor.org/press_room/news_releases/2011/09/ehs_aug


What's been said:
Discussions found on the web: