Last week, Ron Griess of the Chart Store brought to my attention a common misunderstanding about dividend yields.
The charts below show some of the thinking behind our discussions.
To begin with, the common usage of Treasuries — think 10 Year or 30 year for that matter — may not be an ideal comparison. The US sovereign debt has as little default risk as an instrument — certainly much less than any equity has in terms of risk.
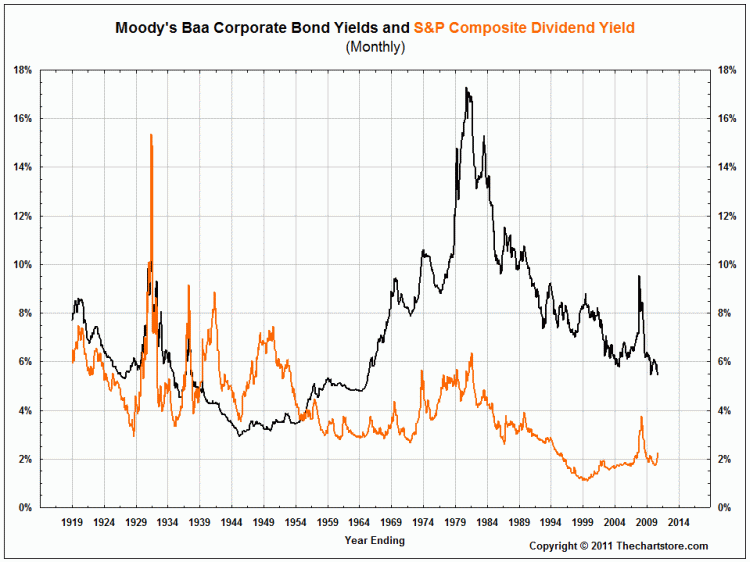
Towards that end, a better measure might be comparable corporates — either Moody’s Aaa or Bbb rated corporate bonds. Note that the charts, which run from 1920 to present, may belie some current assumptions about dividends and Treasuries:
>
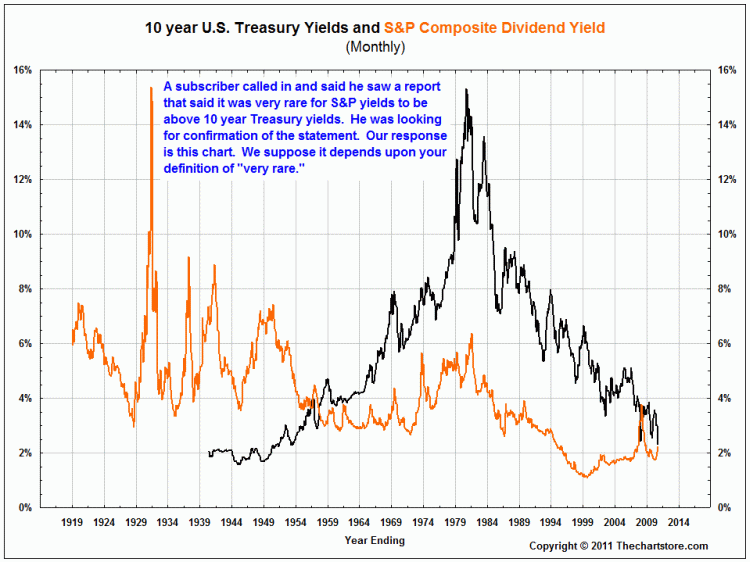
10 year U.S. Treasury Yields compared to S&P Comp Yield
~~~
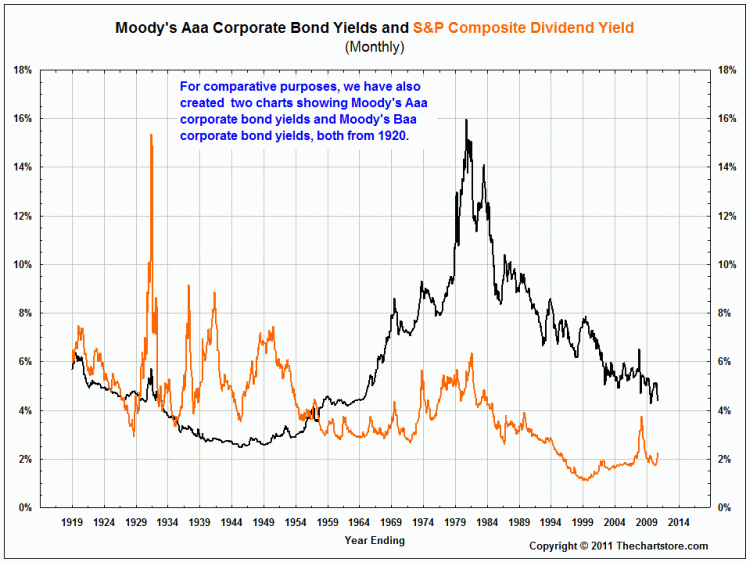
Moody’s Aaa Yields vs S&P Comp Yield
More charts (30 Year Treasury and Moody’s BBB), after the jump
~~~
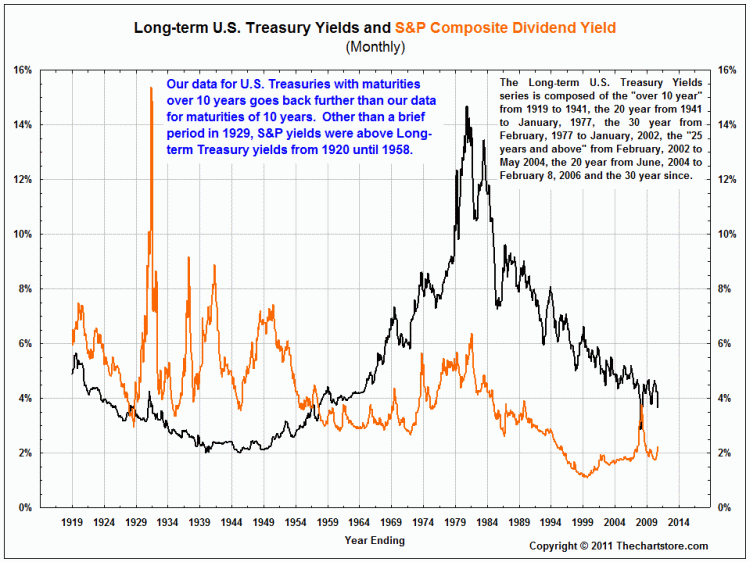
Long-term U.S. Treasury Yields vs S&P Comp Yield
~~~


What's been said:
Discussions found on the web: