The Wall Street Journal – Chart Watchers See Upbeat Turn
Several Technical Analysts Say Stock Moves Last Week May Signal a Market Bottom; ‘Upside Breakout’ Ahead?
Dan Greenhaus, who looks at charts though he doesn’t consider himself a technician, has been watching the size of the S&P 500′s gains. The index rose 1.75% or more for three straight days last week, just the fourth time it has done so since World War II. Every other time has “marked a significant market bottom” or come quite close, says Mr. Greenhaus, who is chief global strategist at New York-based brokerage firm BTIG LLC. In each instance, the S&P 500 was higher one year later, he says. “I’m a bear, but what I’m saying is that I’d be intellectually dishonest if I came across something like this and just buried it,” he says. “We probably could push higher, but you’re talking about a small window, and I don’t have a lot of conviction in that.”
Comment
We decided to take a further look at the highlighted statement above to see if we have hit a ‘significant bottom’ in the stock market after 3 consecutive daily rallies of 1.75% or more last week.
Our analysis shows this is not the fourth time since WWII that the market had three consecutive daily rallies of at least 1.75%, but the eleventh. Additionally, this has occurred 34 times since the 1929 stock market crash. However, this has only occurred 4 times since 1974. We look at these periods in detail below.
October 1974
Let’s begin with the 3-day period in 1974. The chart below shows the S&P 500 from June 20 to December 31 1974. Between October 7 and October 14, 1974 the S&P 500 rose about 16%. Although the market continued to move sideways for the next couple of months, this was, in fact, a significant bottom in the stock market. Technicians would argue that this large three-day “thrust” did not trigger a technical breakout, but this move did occur near the low.
August 1984
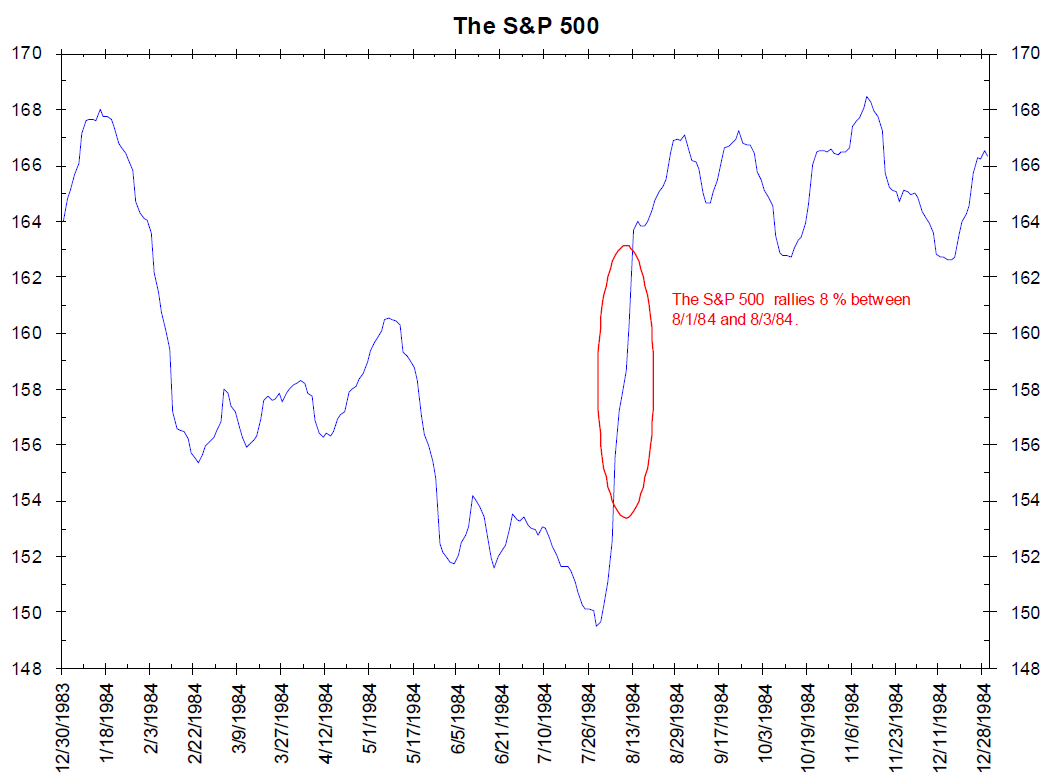
In the beginning of August 1984 the market saw another 3-day period of consecutive daily rallies of 1.75% or more. As the chart on the upper right highlights, the market rallied 8% between August 1 and August 3, 1984. The market continued to rally until the 1987 crash over three years later. Technicians would argue that “thrust” produced a breakout and the market responded by not looking back for over three years.
August 2002
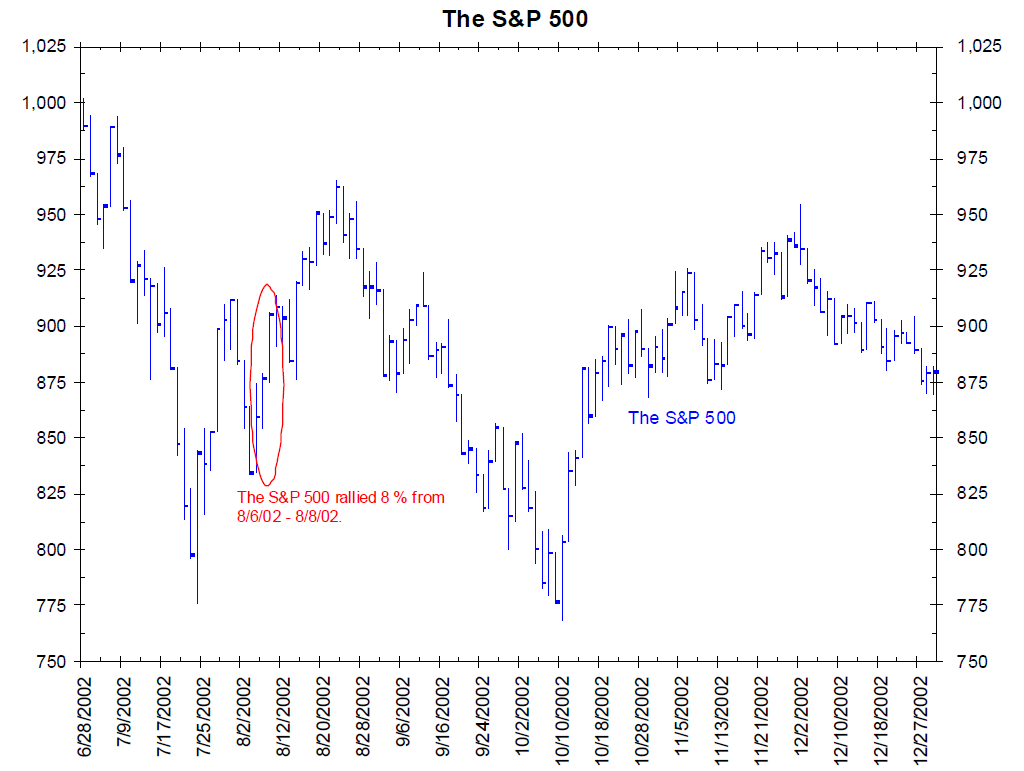
The chart on the bottom right shows the next 3-day period in which stocks advanced by 1.75% or more each day. Between August 6 and August 8, 2002 the market rallied 8%. As the chart below shows, this was not a significant bottom. The market continued to fall another 11% by October of that year (three months later).
October 2011
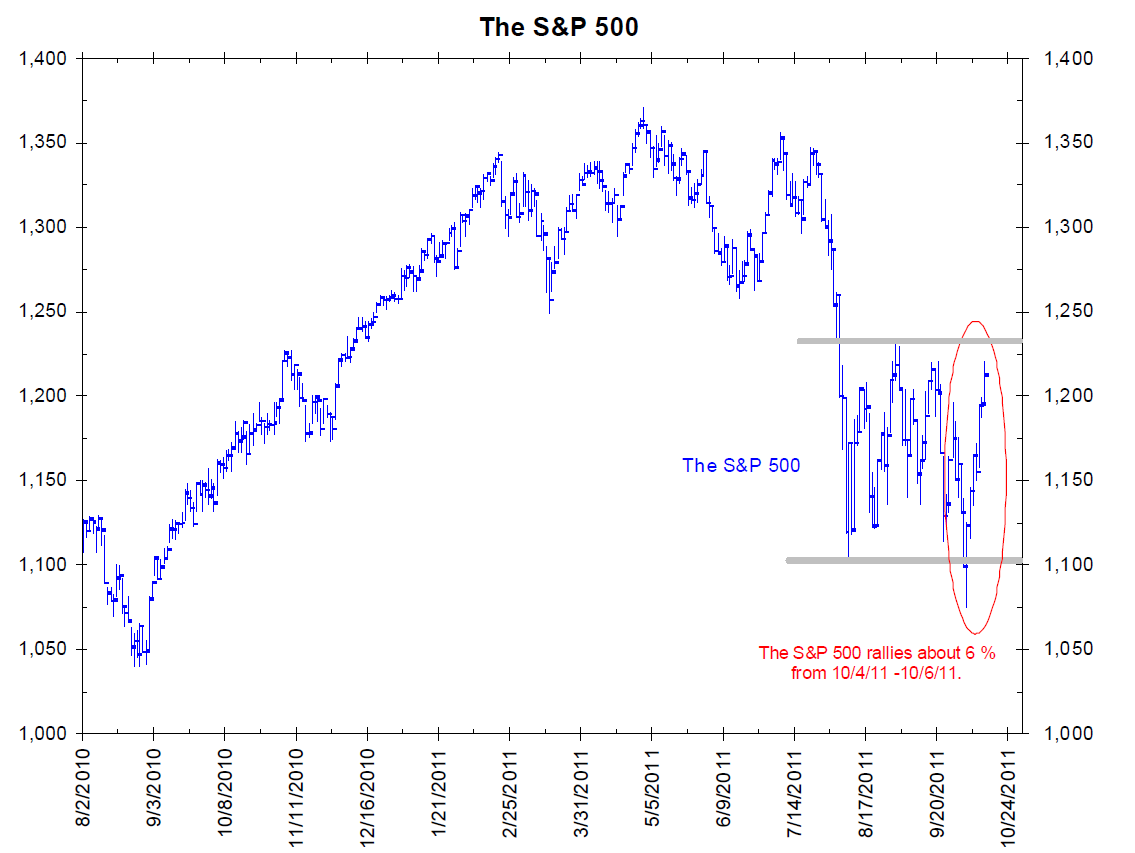
The chart to the right shows last week’s 3-day advance from October 4 to October 6, 2011. Much like the 2002 incident, it is hard to make the case this “thrust” resulted in a breakout (see the thick gray lines).
Conclusion
A lot of people have been talking about this pattern. The implication is this represents a thrust off a low and the start of a significant move higher. History shows this has only been the case when this pattern results in a breakout of the previous range (see 1984). When this thrust results in a move back into a defined range (see 2002), it has little meaning. When the market only barely broke out (see 1974), the market churned sideways for months before moving higher.
Has the market’s trend changed? For now, the answer appears to be “no.” Until a breakout is established (upper gray line), we would not get that excited about the three consecutive daily rallies of 1.75% or more.
Source:
Bianco Research, L.L.C
Charts Of The Week of October 12, 2011


