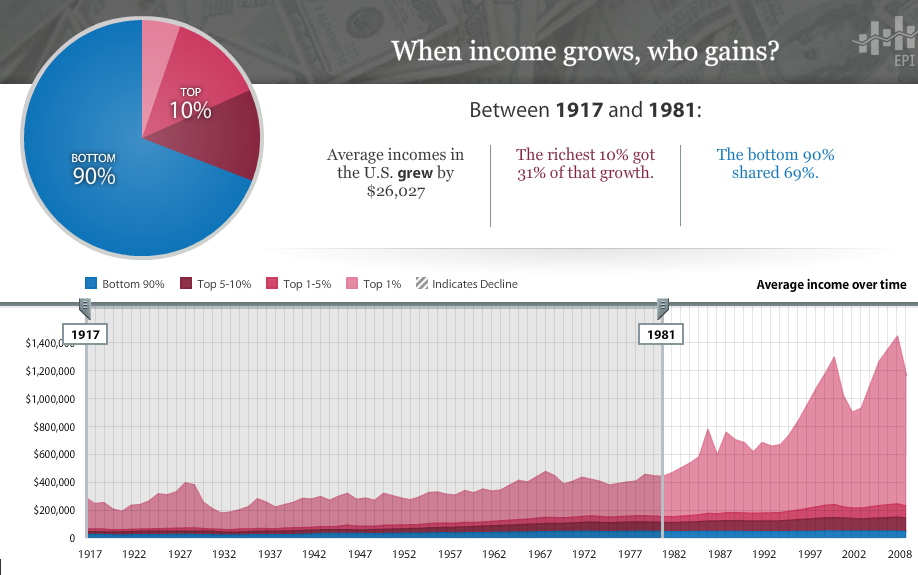
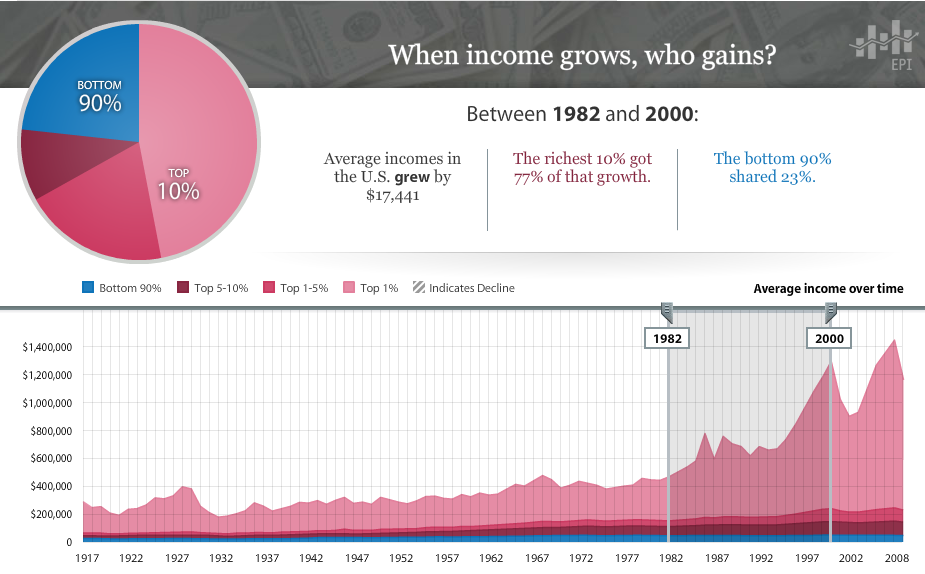
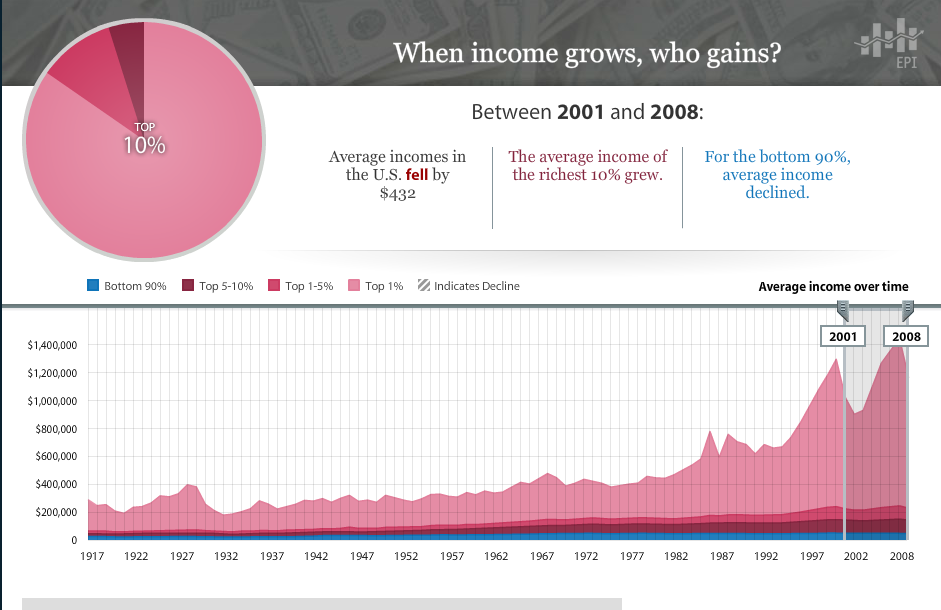
Here is an interesting interactive tool that lets you look at different year ranges based upon societal gains in income, and how they got distributed.
Fascinating to see the shift over the past century:
>
1917-81: Bottom 90% captured 69% of income gains
>
1982-2000: Bottom 90% captured 23% of income gains
>
2001-2008: Bottom 90% had income losses (negative gains)
http://www.stateofworkingamerica.org/pages/interactive#/


What's been said:
Discussions found on the web: