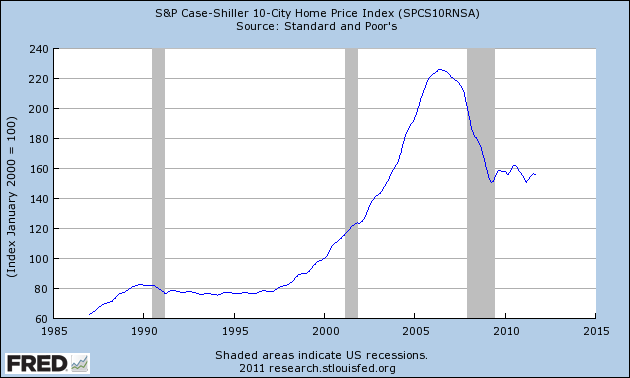
“It’s a little known fact,” as Cliff Clavin would tell us, “that the first city to have its housing bubble burst was Boston.” How appropriate, eh?
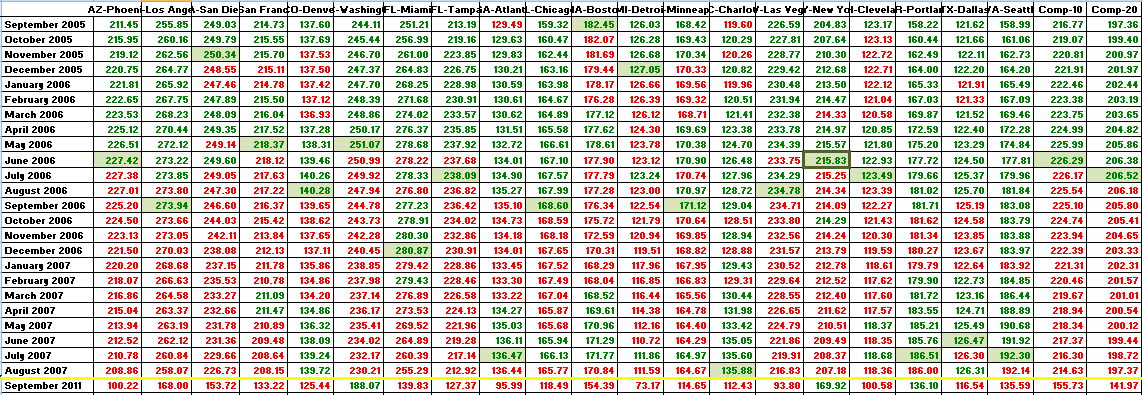
Since no one lives in either Composite10 or Composite20, below is a portion of a spreadsheet I maintain chronicling the popping of the bubble (this is on a NSA basis) in each of the 20 metro areas. Boston kicked things off in September 2005 (peak cells shaded with green), and city after city crested and began its decline over the next two years, ending with Charlotte in August 2007. (Green text signifies an uptick from the prior month, red text a downtick.)
The last row — beneath the yellow line — is the most recent CS print. It’s interesting, still, to see the most recent prints versus the peak values.
(Click through for ginormous — necessary to really see the numbers)
(Source: S&P Case-Shiller. All cities indexed to 100 at January 2000)


What's been said:
Discussions found on the web: