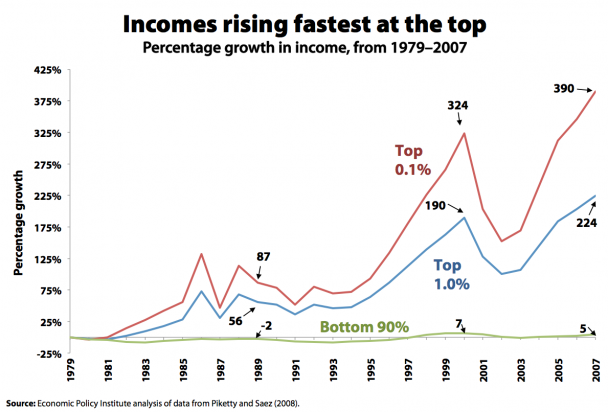
As we have discussed, from 1979 to 2007, inflation-adjusted incomes of the top 1 percent of households increased significantly versus the rest of the wage earners (i.e., the remaining 99%). Those even better off, the top 0.1 percent (the top one one-thousandth of households), saw their incomes grow 390%.
In contrast, incomes for the bottom 90 percent grew just 5 percent between 1979 and 2007. All of that income growth, however, occurred in the unusually strong growth period from 1997 to 2000, which was followed by a fall in income from 2000 to 2007.
Is this wealth concentration a global phenomena, or is it a US centric? Lets go to the global data, via Credit Suisse Research Institute’s Global Wealth Databook:
>
>
>

Source: Credit Suisse, Research Institute
>
And as a reminder, here is the recent growth in the US data, via EPI:

Source: Economic Policy Institute
~~~
UPDATE: November 1 2011 12:51pm
David Wilson of Bloomberg News points out that a rising Misery Indexes worsens the income-gap effect:
Accelerating inflation and historically high unemployment are magnifying the economic effects of income inequality, according to Sean Darby, a global equity strategist at Jefferies & Co.
The U.S. misery index, which increased in September to its highest level since May 1983. The indicator is calculated by adding the 12-month percentage change in the consumer price index to the jobless rate, as compiled by the Labor Department.
Darby cited the gauge and its U.K. version in a report yesterday. In September, the U.K.’s index rose to its highest reading since March 1992 after more than doubling in the last two years.
>


What's been said:
Discussions found on the web: