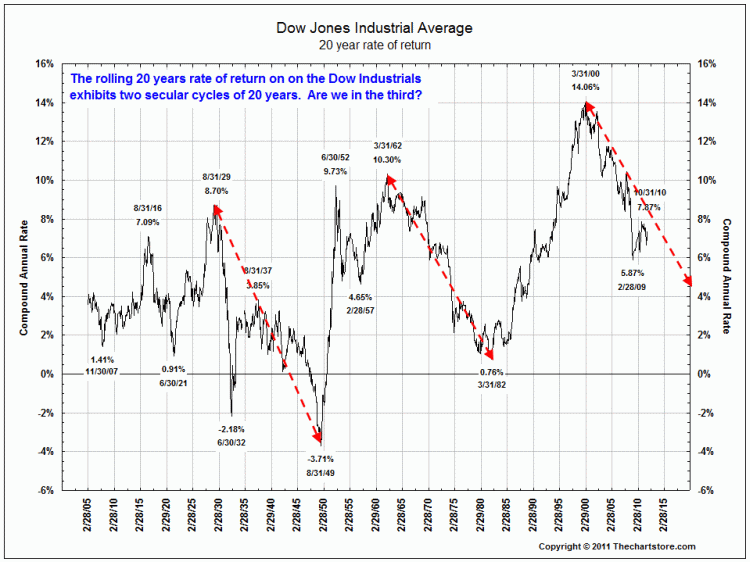
Fascinating chart from Ron Griess of the Chart Store looking at the Dow Jones Industrial Average, via a 20 year rolling return.
The key takeaway is that buying equities when 20 year rolling returns are high is ill advised; making purchases when when 20 year rolling returns are flat to negative seems to generate excellent performance numbers . . .
>


What's been said:
Discussions found on the web: