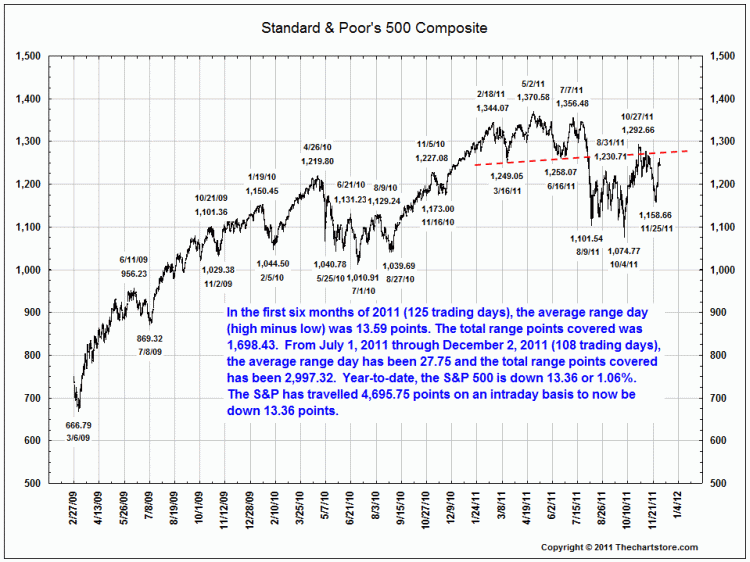
Fascinating chart from Ron Griess of theChartStore, showing the increase in trading action but with no real forward progress.
Since July 1, the S&P has covered nearly 3,000 points since , and almost 5,000 points since January 1, yet is flat for the year:
>


What's been said:
Discussions found on the web: