Matt Trivisonno is an astute observer of tax withholding data. In advance of tomorrow’s NFP, he shares the following charts with us:
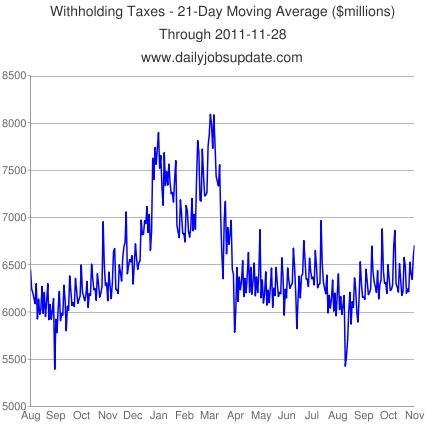
In the first chart attached, you can see the 21-day moving average of federal withholding-tax collections is on an upswing since the summer. But that happens every year, so let’s see how this year’s holiday upswing in payrolls looks compared to last year’s.
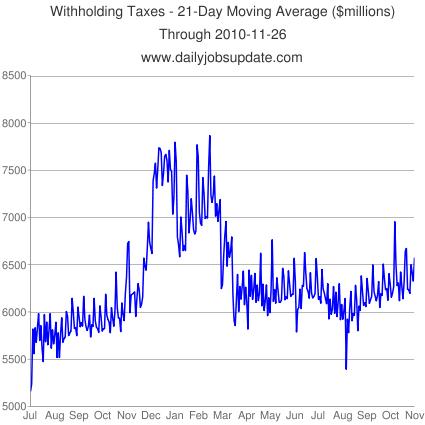
If you line up the second chart beneath, you will see that employment seasonality is almost identical to last year’s. Of course, we had a large payroll-tax cut this year, so it’s safe to assume that the first chart would be much stronger if not for that.
Now, if you look closely at the last two months worth of data on the charts, you will see that the moving average was slightly more perky in October and November this year. And that makes sense because we have 1.5 million more workers on payrolls than we did at this time last year. And those people have more money to spend this year.
While markets have been roiled by events in Europe, there does not yet appear to be any impact at all on the US economy using the withholding-tax collections as our yardstick. And there doesn’t seem to be much risk of a nasty surprise in Friday’s job’s report, though anything is possible of course.
Source:
Daily Jobs Update
by Matt


What's been said:
Discussions found on the web: