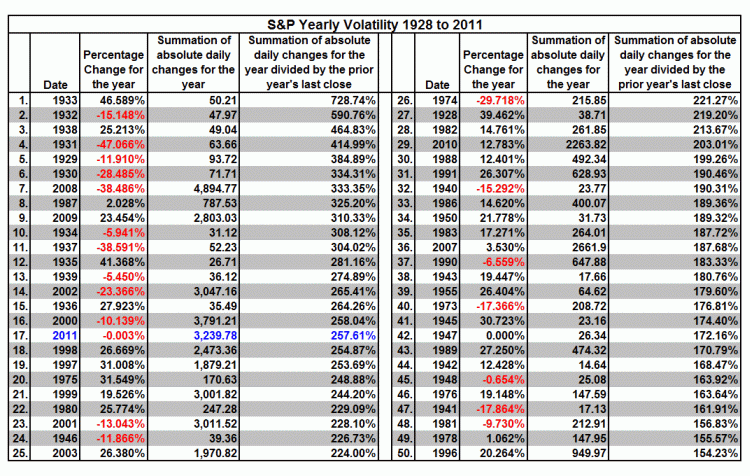
Ron Griess of The Chart Store points us to this a fascinating data point about Volatility:
“There has been much discussion about the recent volatility in the stock market. We did a little study to see how 2011 stacked up against prior years. Our S&P data begins in 1928 and that is what we used for this study. We calculated each days point change, removed the minus sign on down days and summed the daily changes for each year. We then divided that summation by the prior year’s ending value. For instance, in 2011 the summation of the daily changes equaled 3,239.78 points. Dividing that by the ending value of 2010 gives us 257.61%. From the table below, you can see by this methodology that 2011 ranks as the seventeenth most volatile year of the period 1928 to 2011. In fact, four other years of the 21st century rank higher than last year: 2000, 2002, 2008 and 2009. Notice that every single year from 1929 to 1939 are included in the top 15.”
Very interesting stuff . . .
>


What's been said:
Discussions found on the web: