Trend-followers are becoming increasingly bullish because the stock market’s recent uptrend(s) continue to lengthen beyond their expectations. While these trends are clearly unsustainable and increasingly bearish on a contrarian basis, the bullish consensus is not likely at a cyclical turning point extreme – yet.
Very Short Term (days) and Short Term (weeks)
At Thursday morning’s high, the S&P 500 index (SPX) was up 9% in just 23 days, or a whopping 166% annualized, from its Dec 19 low just before the start of the predictable Year-end Holiday Season Rallies, which many market analysts, advisory newsletters and talking heads doubted would even be positive.
The SPX has been up seven of the past nine weeks, gaining 15%, more than a 120% annualized rate, from its Nov 23 low –- three days before which we recommended another buy in our counter-trend, double-profit-potential hedge strategy.
Intermediate Term (months)
The SPX is up five of the past six months through Jan from the Aug 9 low, just days before which time we initially recommended a counter-trend, double-profit-potential hedge strategy, especially in the NDX. In recent days it’s been making 11-year highs, as we originally forecasted. Also, the Dow 30 has hit 3.3-year highs.
Also through its Thursday high, the NDX is up 21% from its Oct 4 low, before which we forewarned about avoiding widespread investor fears of a bearish flag and double-bottom breakdown. We fully expected they would be a “bear trap” and recommended to buy again in our counter-trend, double-profit-potential hedge strategy.
While these are clearly unsustainable trends, we are not yet calling their top, and the following are some of the reasons.
Thursday the Conference Board (CB) released their new Leading Economic Index (new LEI), which rose in Dec. This is consistent with the stock market rising in Dec since six of the other nine components in the new LEI were up in Dec.
Keep in mind that all 0 components in the new LEI are reasonably coincident to each other, so that the group of nine excluding the stock market, is a useful confirming or non-confirming monthly fundamental indicator of the stock market. We further nuance the timing significance of each of the other components, as most are reported before the CB’s report of the weighted composite of all 10.
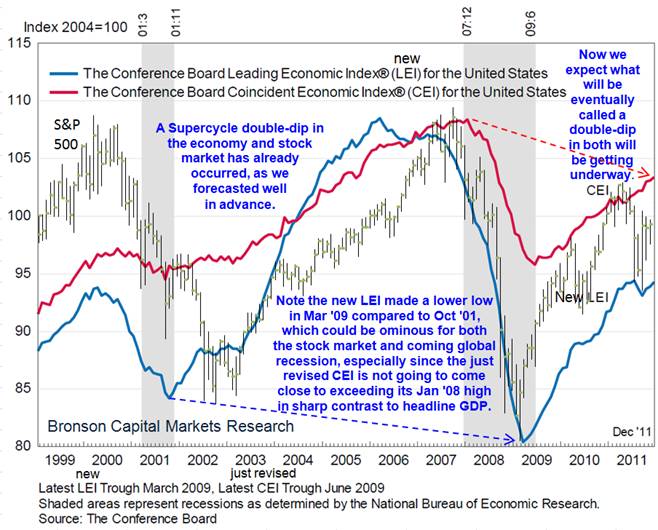
Last year’s July peak in the CB’s new LEI has not been exceeded by the Dec data, as you can see in the second chart below. This is consistent with the May 2 high in the stock market (SPX 1371) holding, which is helpful in zeroing in on the coming high in the now almost six-month rally since its Oct 4 low.
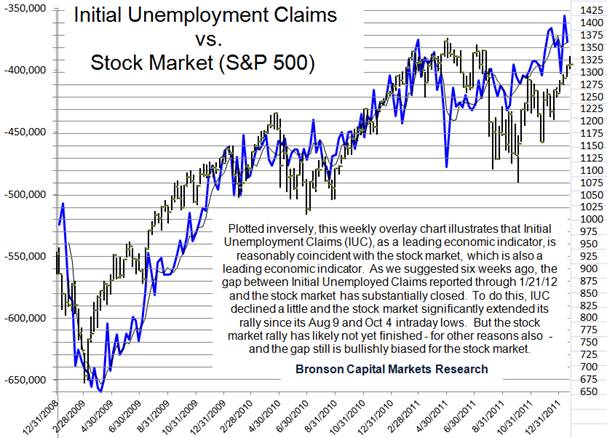
But it’s too early to have high confidence that the another new high two weeks ago in Initial Unemployment Claims will hold for long just because there was a 40% retracement in last Thursday’s reported data. See the first chart below.
Recall in our Jan 10 email to you that we pointed out several reasons of why the coming stock market rally high is not likely to be exceeded by the Annual Cycle’s Strong Season high in March through May in a Presidential election year during a Supercycle Winter.
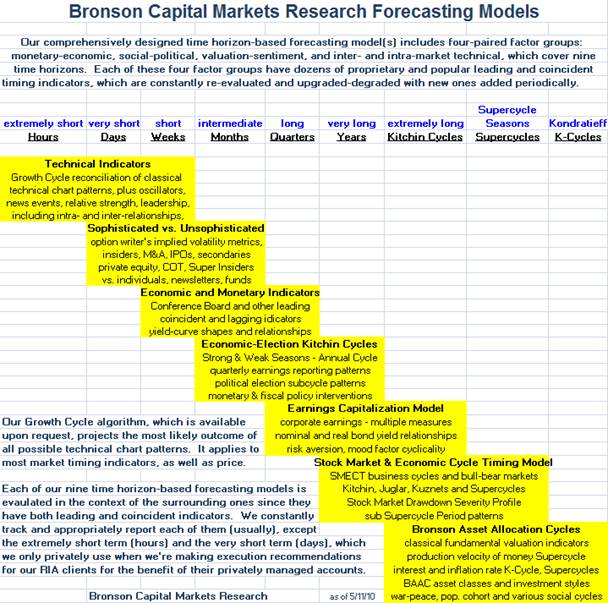
So along with the new LEI and other fundamental and technical indicators in our forecasting models (see the summary table at the bottom) the odds are strong that the best opportunity for taking at least partial profits in the long positions of our counter-trend, double-profit potential strategy is close at hand.
For example, the end of a very short term (days) burst following the coming announcement of an agreement between Greece and its private creditors could create that selling opportunity. If you’re a Wall Street Journal subscriber:
http://www.marketwatch.com/story/hopes-rise-for-greek-debt-deal-2012-01-27
Here’s Bloomberg’s publicly available article on the coming debt swap deal:
http://www.bloomberg.com/news/2012-01-27/greek-debt-talks-drag-on-as-lagarde-keeps-pressure-on-creditors.html
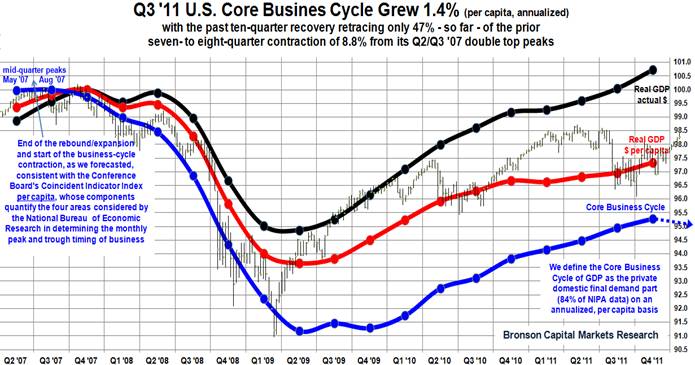
We’ve also updated our quarterly Core Business Cycle chart – third one below – with Friday’s reported initial estimates of Q4 ’11 GDP. Notice that it undercuts the headline report of 1.8% GDP growth, since it’s more important than most any other metric from GDP and it reflects decelerating growth of only 1.4%, down from 2.0% in Q3.
In this regard, we’ve added a technical projection, along with a pair of explanatory charts, illustrating how it was derived. By itself, it suggests the coming business cycle peak and start of the next U.S. recession could be late in the current quarter, but more likely no later than in Q2. Keep in mind that it does not give a lot of information about the extent of the current stock market rally on a very short term (days) or even on a short term (weeks) basis, especially since the “no foreseeable U.S. recession” and “The Fed’s QE 3 is right around the corner” camps are still growing.
We will do the same with our per capita adjustment of the CB’s newly revised Monthly Coincident Economic Indicator Index (revised CEI) when we receive it. The CB does not make their numerical historical data freely available – only the past seven months is reported each month – but they do publish a 12-year chart of the data, which we have analyzed and annotated further below. The coming business cycle peak and start of the U.S. recession, joining the one already underway in Europe (Germany’s Q4 GDP was negative) and in Japan (their entire 2011 GDP results were just revised from slightly positive to slightly negative) – for Wall Street Journal subscribers see:
http://www.marketwatch.com/story/lending-data-points-to-euro-zone-credit-crunch-2012-01-27?siteid=bnbh
and the slowdown in China, don’t tightly time the end of the current stock market rally from its Aug 9 and Dec 4 lows, but they strongly suggest the rally won’t last much longer or go much higher, despite trend-follower’s growing enthusiasm. In fact, to the contrary, we fully expect that consensus to broaden, as the least sophisticated trend-followers join the permabull institutions in rationalizing why they can’t “afford” to miss the underestimated upside opportunity. Be alert to the
CNBC talking heads stumbling over each other to make the “no foreseeable U.S. recession” and “the Fed’s QE3 is just around the corner” claims chiding anyone who disagrees. Much more often than not the peak of their crescendo marks the exact top.
The following chart, with our S&P 500 overlay and annotations, illustrates how the CB’s new LEI and revised CEI better explain our forecasts for double dips in both
the economy and stock market, as well as what’s coming, which will be eventually called a double dip in both, the consensus having rejected that scenario last summer.
The following is a chart illustrating Friday’s report of Q4 GDP data that constitutes our Core Business Cycle metric, which could be called private domestic final demand.
It is real GDP per capita, less private sector inventories, government spending and net foreign trade, since they’re not consistently pro-cyclical and can be very volatile.
The Core Business Cycle part of GDP data shows the stock market (SPX is in the background) is quite overvalued, since the stock market has retraced much more
than the economic recovery has since their ’07 peaks. This does not even consider that our stock market to GDP valuation oscillator hasn’t yet reached its reversion-to-the-extreme target area that we expect it will when the coming U.S. recession ends.
The chart also shows a technical extrapolation – blue dashed arrow – for the current quarter, which suggests the economic recovery will peak and thus the coming U.S.
recession will start in late Q1 ’12. That extrapolation is based on the simple assumption that the deceleration in growth from Q3 to Q4 last year will continue, as is illustrated in the pair of explanatory charts further below.
While it’s a conservative numerical extrapolation of velocity and acceleration in the most meaningful and prescient GDP data, and thus is interesting all by itself, it’s not
a fundamentally-based factor upon which we make our business cycle calls. It is presented because it’s reasonably consistent with the implication from the CB’s new
LEI, as explained above, and with the best-fit extrapolation of the Fed’s Industrial Production index that we presented to you nine days ago.


What's been said:
Discussions found on the web: