This was supposed to launch Saturday at 3pm, but didn’t — I must have screwed up the posting schedule somehow. Family is in from Chicago and I did not notice it.
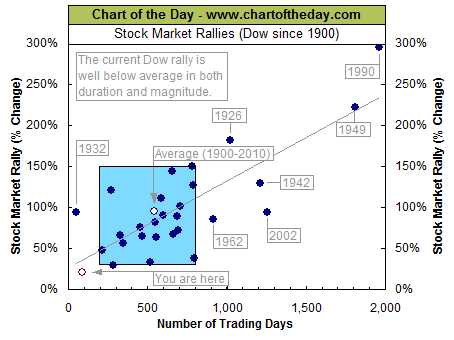
Well, belatedly, here is the Chart of the Day‘s look at duration and intensity of Market Rallies:
>
~~~
UPDATE: Februry 12, 2012 7:33pm
Patrick Neid in comments astutely observes that using the Oct 2011 vs March 09 is rather incorrect and/or misleading. If we use March 2009 as a start date, this is a much older rally.
I will tag CotD and ask them what is the basis of the starting days — did the Flash Crash or the August 2011 correction end that rally?


What's been said:
Discussions found on the web: