>
Retail gasoline deliveries, already well below 1980 levels, have absolutely fallen off a cliff:
“Is the plunge inventory-related, i.e. are storage facilities so full that retailers are simply putting off deliveries? Though I don’t have data on hand to support this, I know from one of my correspondents who is in the gasoline distribution/delivery business that gasoline is very much a “just in time” commodity: gas stations are often close to running out of fuel when they get a delivery. Stations aren’t holding huge quantities of surplus gasoline; that’s not how the business works. Given the absence of “extra storage” in gas stations (and the fact that the number of gas stations has fallen dramatically since 1980), it is reasonable to conclude that retail delivery is largely a function of demand, i.e. gasoline consumption.
Even if you dismiss the recent plunge as an outlier, the declines in retail gasoline deliveries are mind-boggling.
–Why Is Gasoline Consumption Tanking?
>
Comment:
The Energy Information Administration approximates U.S. energy consumption by a statistic known as “weekly product supplied.” This is the amount of petroleum product supplied to an end-user such as a gas station. It is a very timely statistic as the last plot is through February 3.
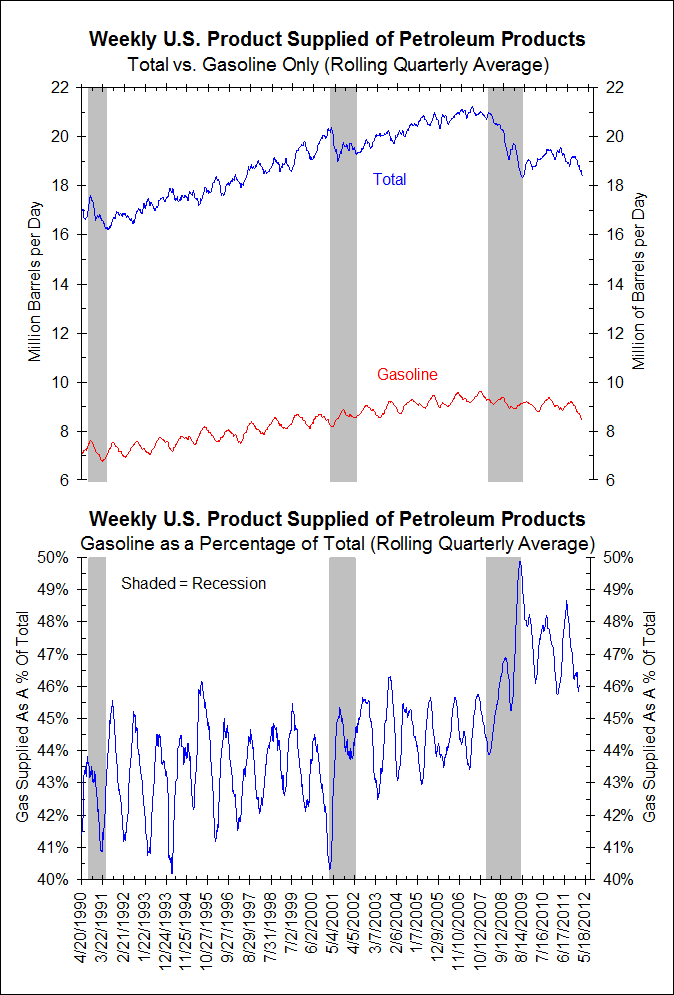
As the chart below shows, total weekly U.S. product supplied of all petroleum products currently averages just over 18 million barrels per day, 8.5 million barrels of which is gasoline. The rest of the total petroleum product supplied consists of fuels like heating oil, propane and kerosene (jet fuel).
>
Consumption of petroleum products, especially gasoline, is a broad-based economic indicator. Increased consumption coincides with higher economic activity and lower consumption occurs in recessions, as the shaded areas above show.
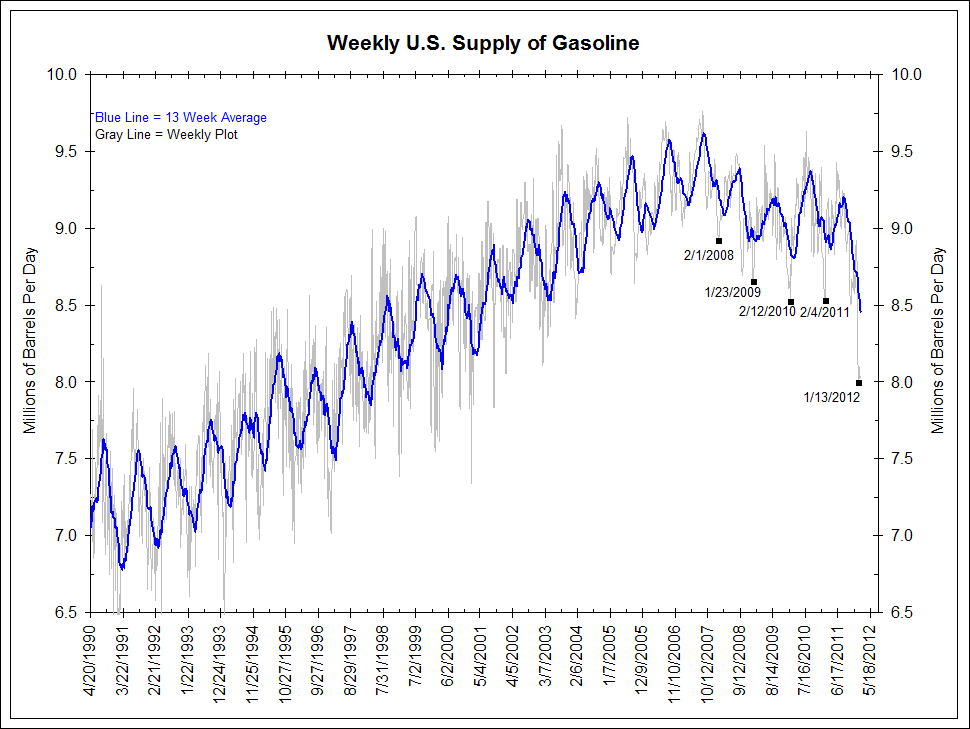
The story above highlights the recent collapse in weekly U.S. gasoline consumption, which is shown below (gray line). Weekly gasoline consumption hit 8.0 million barrels per day the week of January 13, the lowest level since September 21, 2001 (the wake of 9/11 when all travel was voluntarily reduced). It has hardly rebounded in subsequent weeks.
Note this data is very seasonal. Highlighted on the chart are some of the recent late January/early February winter months readings which often show the lowest consumption of the year.
While some of the current January/February decline can be attributed to seasonal factors, the unusually mild winter argues against a collapse of the magnitude shown above. It suggests that something more is going on.
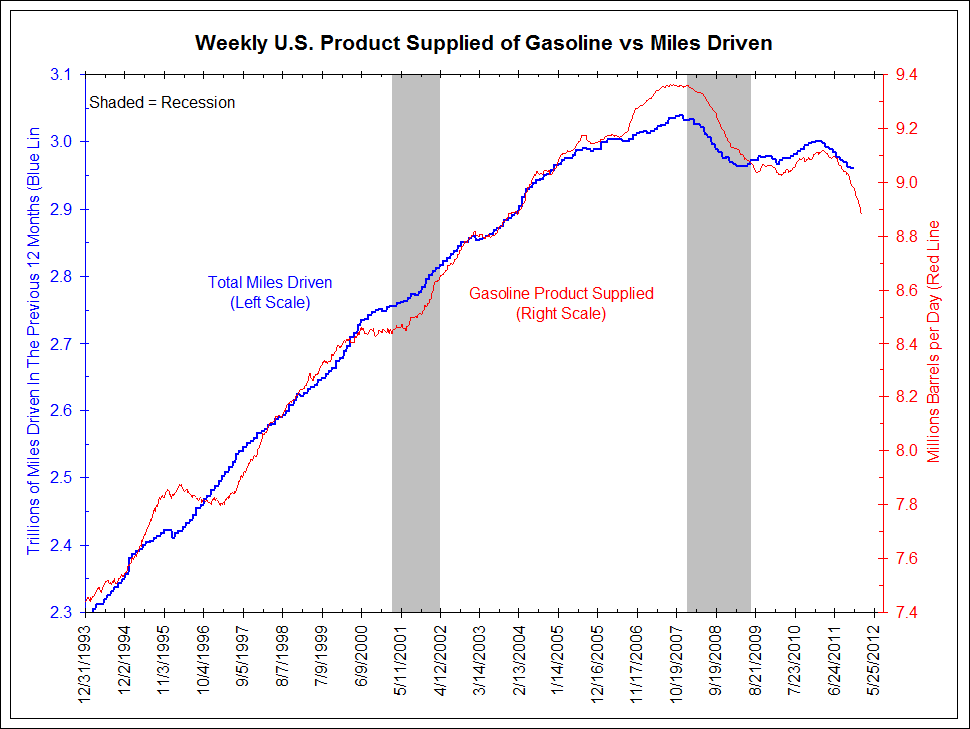
The chart below minimizes seasonal factors by showing the annual movement in gasoline supplied to end-users and total annual miles driven which closely tracks it (a monthly measure that is only current through last November). Even after compensating for seasonal factors, gasoline consumption is at its lowest level since November 2003 and falling. Total miles driven is following it lower.
While it is possible that cars are more fuel efficient which means less gas used, more fuel efficient cars would not lead to less miles traveled. So even factoring in the preference away from SUVs and toward better MPG cars, we are still left with fewer miles being driven and less gasoline consumed, especially in the last several weeks. A drop over this short a period of time cannot be explained by a shift to more fuel efficiency alone.
Is the Economy Really Slowing?
Economic activity almost always requires travel. Whether commuting to work, driving to a store, getting goods delivered, or taking a vacation, more miles driven and more gasoline used means higher economic activity. This is not controversial, as we discussed a few years ago.
So, it comes as a surprise that these measures of broad-based economic activity (gasoline consumed and miles driven) are falling hard at a time when most economists are in agreement that the economy has been getting better in recent months. If the economy is indeed getting better, it seems to be happening while we are driving less and consuming less gasoline. For the American economy, this is really hard to do. It has never happened before in the data shown above. All other instances of declining miles and gasoline consumed occurred in or around a recession.
We would not suggest that these economic indicators trump all others and the economy is actually worsening. But it is disconcerting that these measures of critically economic activities are heading lower in a hurry.
Maybe these two measures are sending false signals, but it is possible they are really pointing the way for a faltering economy. For now we will watch these measures and report on them in coming weeks to see if they eventually square with other broad-based measures of the economy that say things are getting better.
Source: Bianco Research


What's been said:
Discussions found on the web: