Today’s selloff is the first major drop that 2012 has seen. Surprisingly, traders seem to have forgotten that we had 1% moves almost daily throughout 2011.
Its too soon to say whether this is a one off or an early look to economic slowing.
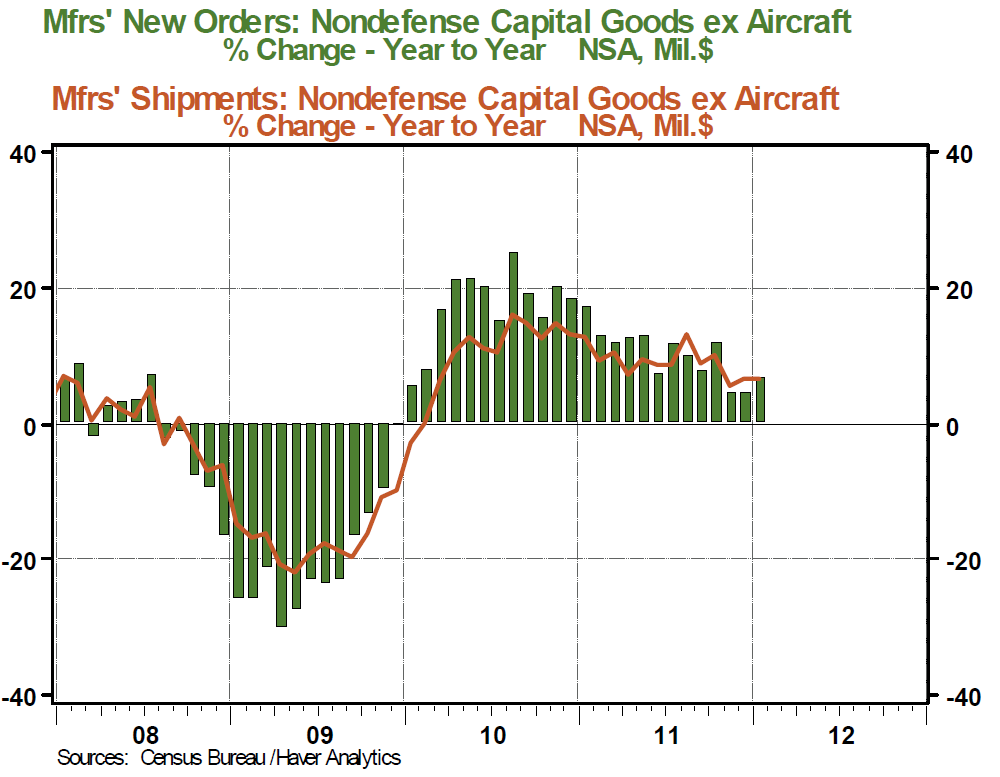
We can, however keep our watch on these three charts — these are the ugliest charts in the universe of basic economic data. If they begin to turn up, it will be clear the economy is fully on the mend. So far, they have shown no signs of improvements.
>
˜˜˜
˜˜˜
Source:
Northern Trust
Daily Economic Commentary
February 28, 2012


What's been said:
Discussions found on the web: