What a difference a couple days makes. Last Monday Jon Hilsenrath, widely known to have the inside scoop on Federal Reserve policy, announced that the “Fed Takes a Break to Weigh Outlook.” Fearing an end to quantitative easing, the S&P 500 dropped nearly 21 points the following day (DJIA down 200). Almost on queue, the Federal Reserve responded two days later (Wednesday) via another Jon Hilsenrath story titled, “Fed Weighs ‘Sterilized’ Bond Buying If It Acts.”
We railed against this sudden change of heart in Last Thursday’s Newsclips. The Federal Reserve, and government in general, have such a large presence in today’s markets that many market-based measures have been skewed to the point of uselessness. How are investors supposed to navigate the financial landscape when the Federal Reserve/government are the single largest determinants in market movements and they send differing signals every other day?
Measuring Policy Uncertainty
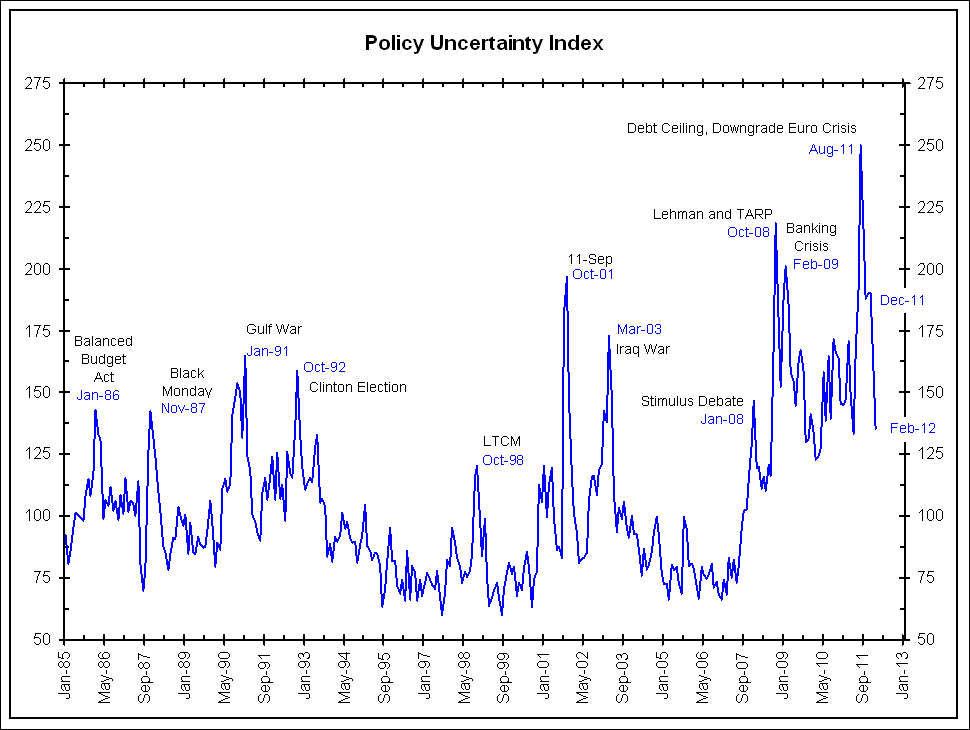
In light of these developments, we have taken much interest in the research conducted by Steven Davis, Scott Baker, and Nick Bloom of the University of Chicago. The have created the Policy Uncertainty Index shown below in an attempt to quantify economic policy uncertainty.
The index is built on three different sub components:
* One component quantifies newspaper coverage of policy-related economic uncertainty. It has a one-half weighting.
* A second component reflects the number of federal tax code provisions set to expire in future years. It has a one-sixth weighting.
* The third component uses disagreement among economic forecasters as a proxy for uncertainty, both for federal spending and municipal spending. It has a two-sixth weighting.
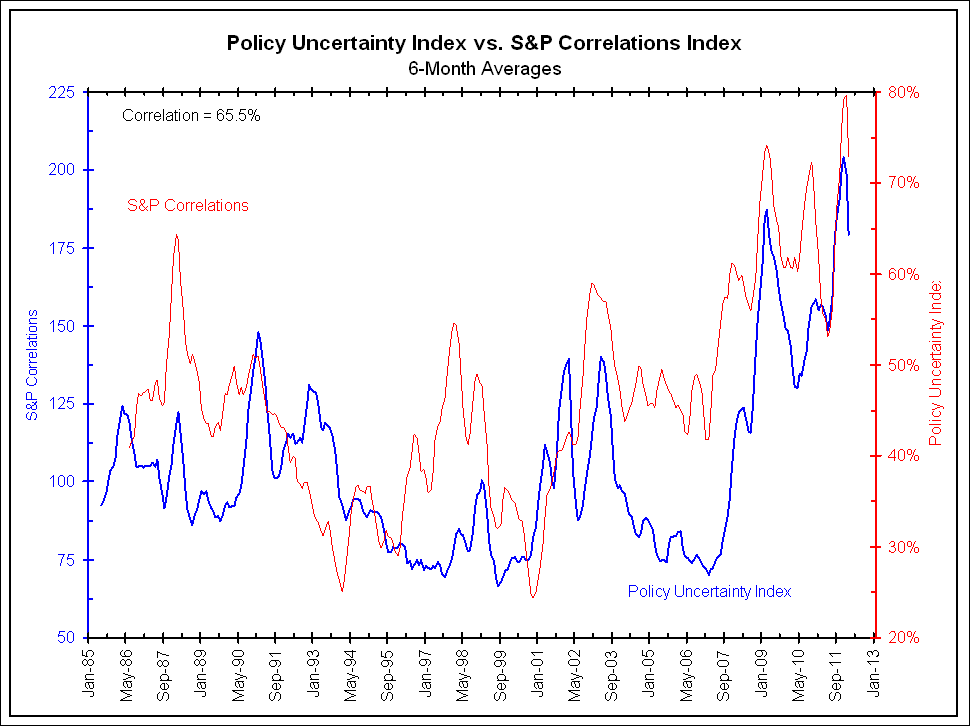
If this series looks familiar, it should. We often highlight the average correlation of each of the individual stocks in the S&P 500 to the overall index. This series, shown in red below, correlates rather well to the Policy Uncertainty Index in blue.
In explaining the high correlation among stocks, we said:
Simply, the actions of people like Ben Bernanke or Mario Draghi matter far more than any specific fundamental of a company. It’s as if every S&P 500 company has the same Chairman of the Board that only knows one strategy, resulting in a high degree of correlation between seemingly unrelated companies.
Massive central bank/government involvement in markets risks returning us to a de facto centrally planned economy. Every time the Federal Reserve opens a swap line, the ECB hints at another program to stem the crisis, or successful American money managers wonder if the Federal Reserve could directly buy Italian bonds, the central banks/governments are trading a short-term fix that raises all boats, even the bad ones, for an even more inefficient capital allocation process. Winners must be rewarded and losers must fail. High correlations among markets leading to poor performance are an indication that this is not happening today and it is hurting the economy.
This policy uncertainty index seems to be a good way to measure this. So, when does the high correlation between stocks and the index itself go away? This will occur when policy uncertainty goes away. Right now uncertainty is still relatively high even though the average correlations are falling.
Source: Bianco Research


What's been said:
Discussions found on the web: