I have been hearing this tired line since 2006. Its time to retire it as a misleading foolish bit of money-losing misdirection.
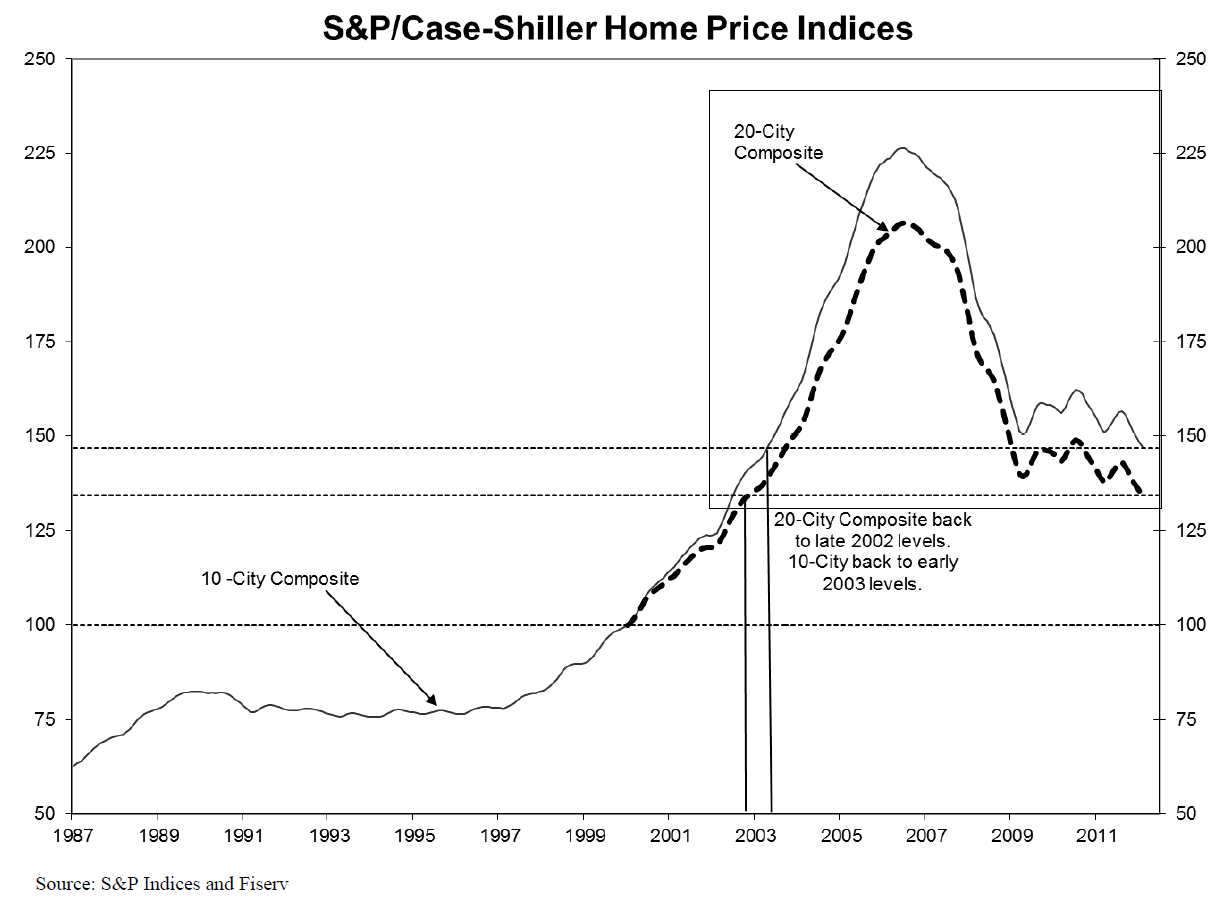
Lets take a look at the full price index — 1987 to 2012 — and I have boxed off the section I want to focus on:
>
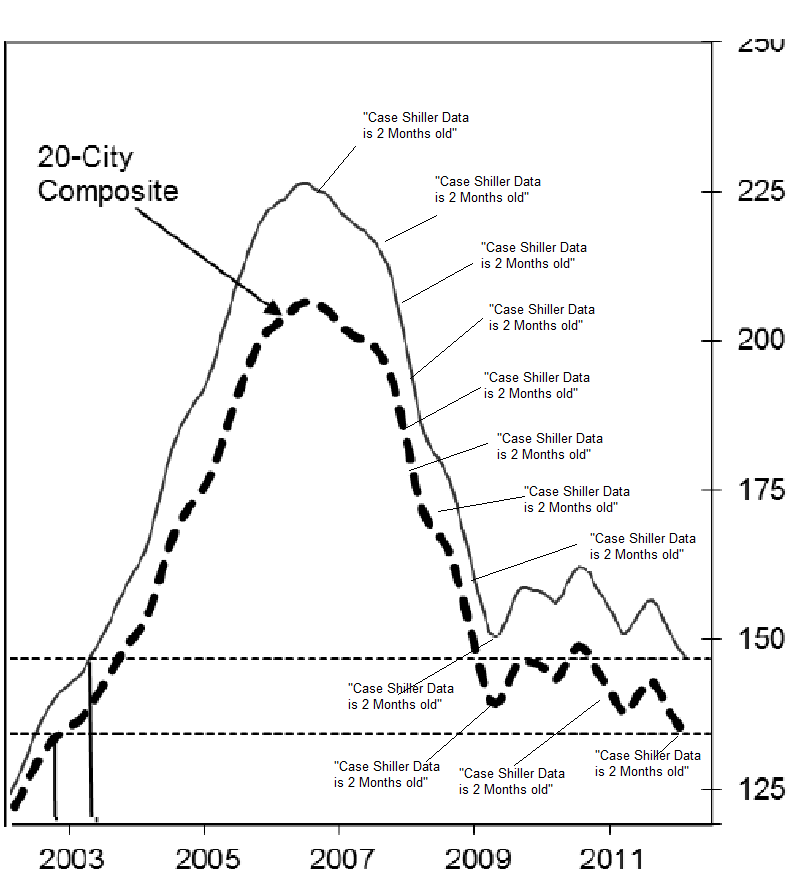
If we were to zoom in on that box covering the peak downwards, it looks like this:
>
Its pretty self-evident that claiming a data series is 2 months old during a 72 month slide borders on insanity. The overall trend has been devastating, the entire 60 day lag down . . .
What about prices and homes sales stabilizing?
Well, not exactly — even that bottom scraping that looks like stabilization is the result of a massive concerted effort between multiple bailouts, fed actions and tax credits:
>
Source Street Talk Live by way of Charles Smith
>
Previously:
Closer Look at the Housing Recovery Meme in 5 Parts (April 17th, 2012)
1. Debunking the Housing Recovery Story: Shadow Inventory.
2. Home Affordability Reality Check: Can Buyers Afford Homes?.
3. The Problem With Home Prices (Still too high).
4. Foreclosures: A Decade Long Overhang.
5. Fear of Buying: The Psychology of Renting.


What's been said:
Discussions found on the web: