With dividend payments at an all-time high and much of the Treasury yield curve effectively at zero, dividend-paying stocks have been in vogue as of late. Many investors are willing to reach out a bit further on the risk curve to capture this extra yield.
Rather than viewing dividend stocks as a way to capture extra yield, in the past we have stressed that dividend stocks should simply be viewed as a slightly less risky form of stock investing. As such, we should expect dividend- paying stocks to outperform during bear markets and underperform during bull markets.
By comparing the S&P Dividends Aristocrats Total Return Index and the S&P Equal Weight Total Return Index, we can see this is indeed the case. The S&P Dividends Aristocrats Index measures the performance of stocks in the S&P 500 that have consistently increased dividends for at least 25 consecutive years. The index is equally weighted, so we compare its total return to that of the S&P 500 Equal Weight Index.
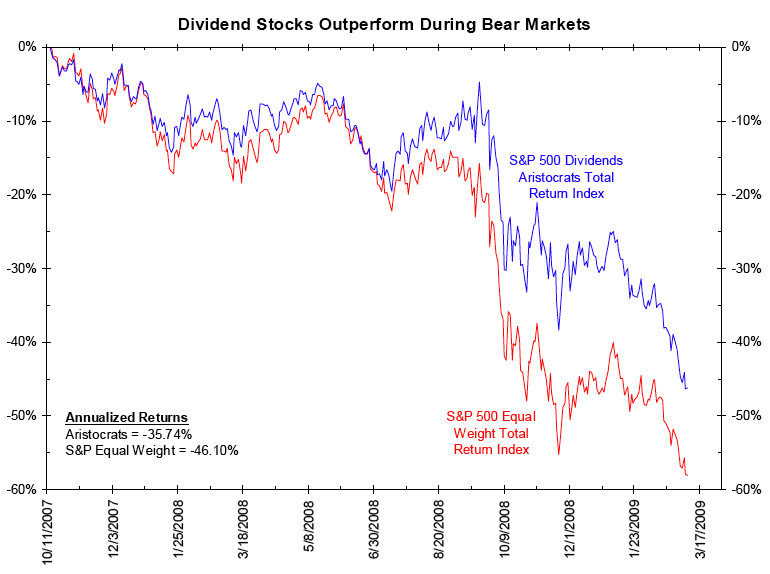
During the bear market from October 11, 2007 to March 6, 2009, dividend-paying stocks outperformed the S&P 500 Equal Weight Index by 11.6%. On an annualized basis, dividend stocks returned -35.74% versus -46.10% for the S&P Equal Weight Index.
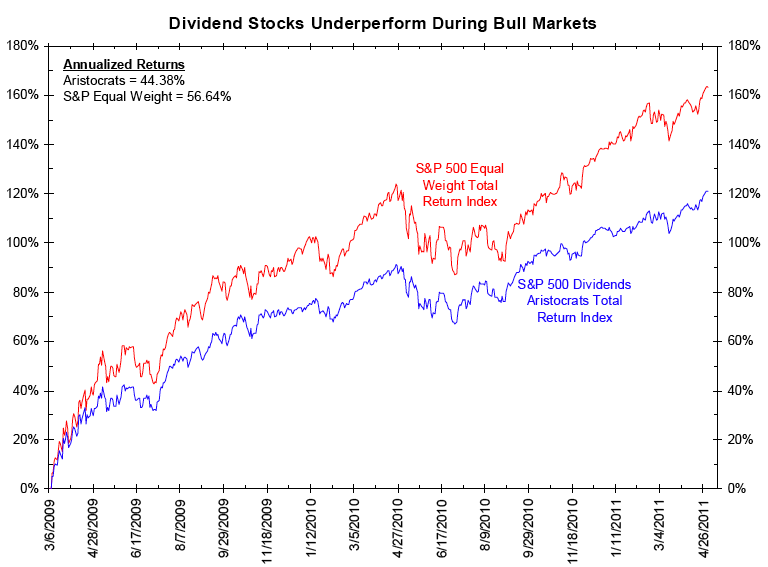
During the bull market from March 6, 2009 to May 2, 2011, dividend-paying stocks underperformed the S&P 500 Equal Weight Index by 42.4%. On an annualized basis, dividend stocks returned 44.38% versus 56.64% for the S&P Equal Weight Index.
Click to enlarge:
˜˜˜
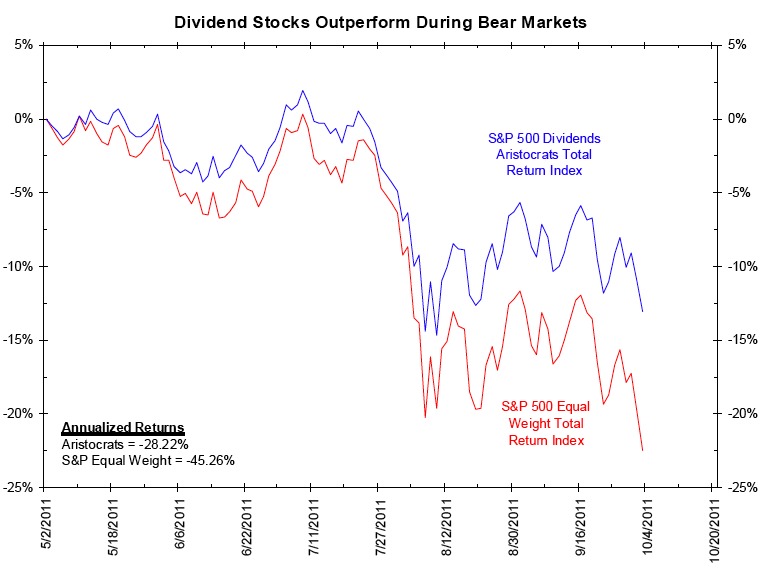
During the bear market from May 2, 2011 through October 3, 2011, dividend-paying stocks outperformed the S&P 500 Equal Weight Index by 9.40%. On an annualized basis, dividend stocks returned -28.22% versus -45.26% for the S&P Equal Weight Index.
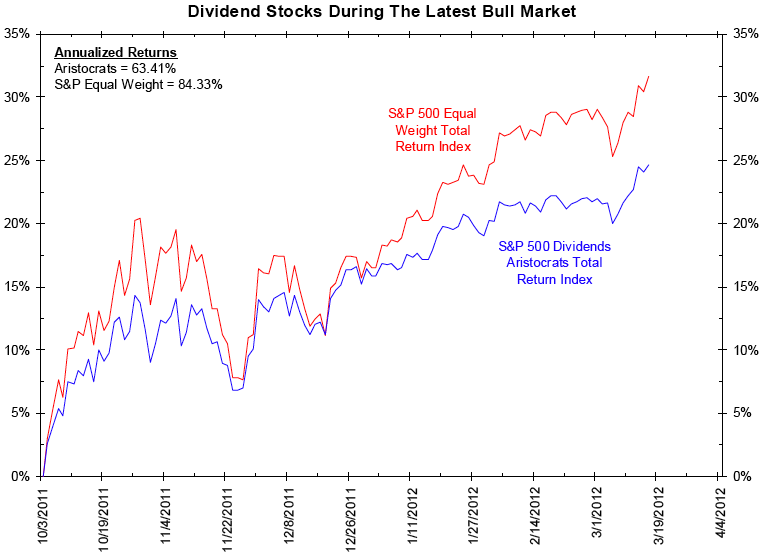
During the latest bull market from October 3, 2011 through March 15, dividend-paying stocks underperformed the S&P 500 Equal Weight Index by 6.94%. On an annualized basis, dividend payers returned 63.41% versus an annualized return of 84.33% for the S&P 500 Equal Weight Index.
To be sure that these past few bull/bear markets were the rule and not the exception, we also compared total returns of these two indices on all days when the S&P Total Return Index was up versus all days when the S&P Total Return Index was down. With data going back to the beginning of 1990, dividend-paying stocks returned an average of 66 basis points per day on days the stock market was up. The S&P Equal Weight Index returned an average of 78 basis points per day on those same days. On days the stock market was down, dividend-paying stocks returned an average of -67 basis points per day. The S&P Equal Weight Index returned an average of -81 basis points per day.
Rather than being concerned with reaching for yield, the charts and data on this slide and the previous slide suggest dividend stocks outperform during bear markets and underperform during bull markets. However, if investors are savvy enough to know which way the market was heading in general, why even bother distinguishing between dividend- paying stocks and non-dividend-paying stocks?
˜˜˜
Source:
Bianco Research
Charts Of The Week
Pictures of Current Interest
March 21, 2012


What's been said:
Discussions found on the web: