 Macro Factors and their impact on Monetary Policy
the Economy, and Financial Markets
MacroTides.newsletter@gmail.com
Investment letter – April 17, 2012
;
Doubling Down in Europe
In last month’s letter we discussed the low level of volatility in the stock market, and wondered if the perception that the European debt crisis was contained was correct. We didn’t think so, since the primary factors driving the crisis would continue to deteriorate in 2012. We noted that at some point in 2012, bond yields in Portugal, Spain, and Italy would rise as investors realized these countries would likely remain in recession in 2012. A prolonged recession will make it nearly impossible for them to lower their debt to GDP ratios and budget deficits. Furthermore, the austerity measures each country is adopting to comply with EU rules haven’t even been implemented, which virtually guarantees these countries will remain in recession during 2012. We surmised last month that the tipping point would come when investors begin to compare the increase in yields in these countries to Greece’s experience. We expected the volatility index would remain low until investor’s perceptions were confronted with this reality. It appears we are fast approaching the tipping point.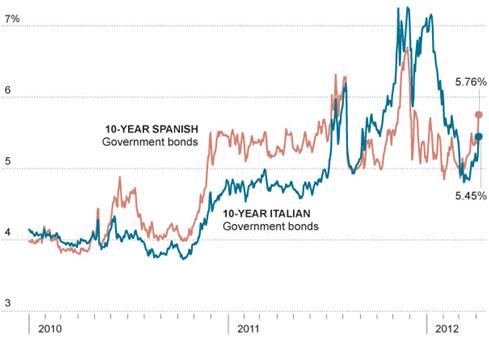
Since mid March, the yield on the Italian 10-year government bond has jumped from under 5.0% to 5.52% on April 13, while Spanish yields rose from under 5.0% to 5.98%. While money has been moving out of Italian and Spanish bonds, it has been flowing into German bonds, as investors seek safety, driving yields down from 1.87% at the beginning of March to 1.73%.
The increase in bond yields in Spain has not gone unnoticed by investors, as stock markets around the globe have sold off. The pronounced weakness in European bank stocks has reminded everyone how intertwined the sovereign debt crisis and European banking crisis are, and how difficult it will be in coming months to hold the European Union together. Between March 27 and April 10, the volatility index (VIX) jumped from 14.14 to 21.06, an increase of almost 50%. In the process, the VIX has climbed above its short term moving average (green) for the longest period, since the December lows. A close above 21.25 on the VIX would represent a breakout, and carry the VIX above its long term average (red), likely signaling an extended period of volatility.
 We expect the situation in Spain to continue to deteriorate. In January and February, Spanish banks were big buyers of Spain’s government debt. This helped push yields lower, even though foreign buyers were reducing their exposure. Our guess is that banks in other Euro countries (France, Germany, etc.) were sellers to some extent.
 The recent sell off in Spanish bonds has lowered the value of recently acquired and older Spanish bank government bond holdings. The funding squeeze on banks in Spain has increased significantly since the end of March. This has caused them to increase their borrowings from the ECB. In March, loans from the ECB to Spanish banks rose to $415 billion (316.3 billion Euros) almost double the amount of borrowings in February. This is not a good sign, and suggests that Spanish banks are experiencing a severe liquidity problem. Since they are unable to borrow funds in the capital markets, they are turning to the ECB as the lender of last resort. These borrowings represent more than one-third of Spain’s GDP. Italian banks borrowed $354 billion in March from the ECB, which suggests they are also experiencing funding issues. However, Italy’s GDP is almost twice the size of Spain ($2.2 trillion versus $1.2 trillion), which underscores just how excessive the Spanish bank borrowing is in relation to its economy.
We expect the ECB to announce another ‘plan’ to help bring Spain’s borrowing costs down. Although this might help a bit in the short run, and spur a rally in equity markets, it will not address the long term structural problems facing Spain. Much like Greece, Portugal, Italy, and Belgium, Spain simply has too much debt and too little economic growth to service its debt. Spain also cannot compete with Germany’s low cost of production, so it can’t increase GDP growth through exports. And, as part of the Euro, it can’t lower its currency to gain competitiveness, as other countries not bound by a single currency have done. All of these countries are effectively in a straight jacket, with austerity as the acceptable option only a masochist would choose. The disparity in the cost of production between Germany and Spain, Italy, Portugal, and Greece will require significant changes in the labor laws in each of these countries. The entrenched labor unions will fight the necessary changes at every opportunity. We expect labor strikes, marches, and riots to become common place in these countries. It’s going to take years to implement the needed structural changes at a minimum, and a lot of heartache.
Youth unemployment throughout the Euro Zone is an epidemic that is progressively becoming chronic. The average unemployment rate for those between 15 to 25 years old is 21.6%, with Spain leading the pack at 49.9% and Greece not far behind.
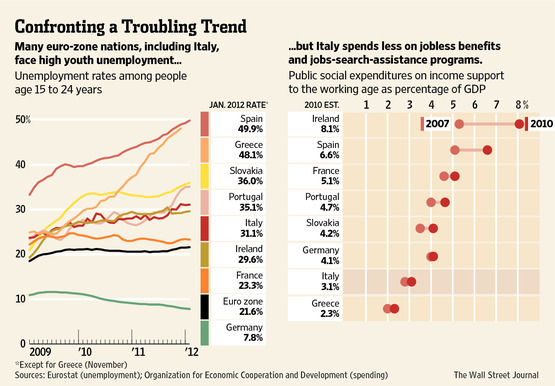
As the recession persists in many of these countries, a generation of young people will not have the skills needed to become productive members of their country’s workforce. This will only make the task of increasing productivity and gaining competitiveness more difficult. With so many young people out of work, increasingly disillusioned and angry, the potential of instability will rise and likely result in a number of governments falling, as opposition parties gain traction by denouncing imposed austerity and ultimately membership in the European Union. The times they are a changing.
China
As we discussed last month, China is embarking on an audacious program to shift from its reliance on exports and internal fixed infrastructure investment for economic growth, to a greater dependence on domestic consumption. This transition will take at least a decade to accomplish. Between 2000 and 2010, fixed investment rose to 48.6% of GDP, while consumer consumption fell to 35%. In order to increase domestic consumption, incomes for the average Chinese worker must increase. While higher wages are good for Chinese workers and will lead to an increase in domestic consumption, they will also push China’s inflation higher. China’s central bank will face a challenge in balancing these opposing forces.
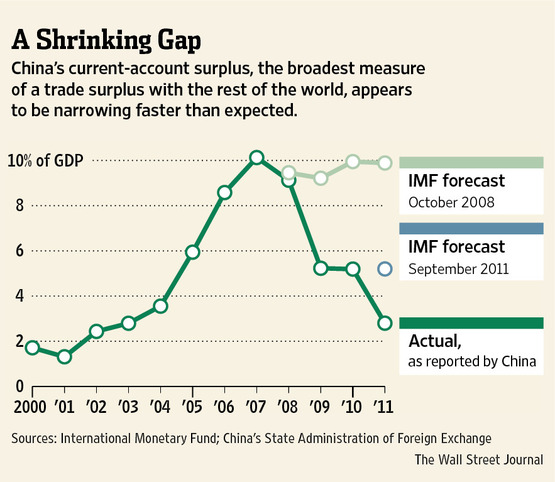 In an ideal scenario, Chinese export growth would remain strong in coming years as China labors to boost domestic consumption. That is not what is happening. Since the financial crisis in 2008, China’s current account surplus has been shrinking dramatically, falling from 10% of GDP in 2007 to just over 2.0% in 2011. This shouldn’t come as a complete surprise, as Europe is China’s largest export market and the U.S. is second. The rebound in the U.S. since 2009 has been the weakest recovery post World War II, and Europe went into recession at the end of 2011, after its own anemic recovery in 2010 and early 2011.
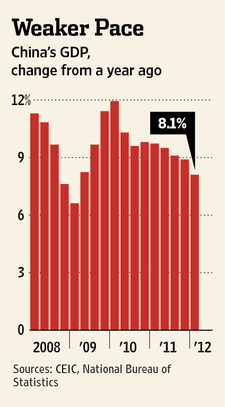
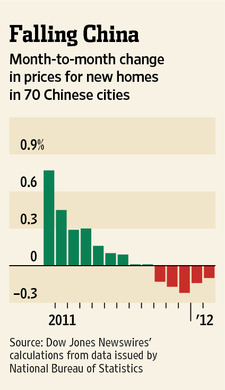 China’s GDP grew 8.1% in the first quarter, which was down from 8.9% in the fourth quarter and the fifth consecutive quarter it has fallen. Given the outlook for Europe, China is not going to get an export lift from European demand. As noted last month, China is also experiencing a deflating housing bubble. Slowly but inexorably real estate values are slipping in 70 of its major cities. In a sign of things to come, a small developer in the city of Hangahoo went bankrupt last month.
We think the Chinese government is concerned, as they survey the global economic landscape and the trends within China. Inflation ticked up to 3.6% in March, versus last year, and up from February’s reading of 3.2%. Bank lending is a centerpiece in China’s monetary policy and is controlled by Beijing, which tells banks exactly how much to lend. Despite the sticky level of inflation, lending soared in March, which was the biggest monthly extension of credit since January 2011. Total loans are 15.7% higher than in 2011. M2 money supply rose to a three-month high of 13.4 percent in March from a year earlier, ahead of forecasts for 12.9 percent growth and February’s 13 percent expansion. This suggests to us that China is choosing in the short run to increase its fixed investment lending in order to give the economy a lift. Although it will likely help, it will also create a larger excess capacity problem down the road. Like politicians everywhere, China’s leaders are more focused on keeping power now, than risk social problems that would emerge if China’s economy slows too much.
Slower export growth and the resulting excess capacity, which is not being offset by current domestic demand, combined with falling real estate and land values will pose significant risks for China’s banking system in the next two years. Although China is likely to avoid a hard landing in 2012, the risks are to the downside, especially in 2013.
U.S. Economy
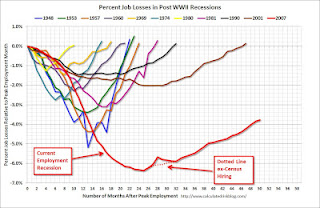 Our expectation has been that the U.S. economy would gradually slow as 2012 progressed. In January and February, just about every economic report matched or exceeded expectations. In recent weeks though, an increasing number of reports, although still positive, have come up a bit short. For instance, the New Orders Index within the March ISM Manufacturing report dipped to 54.5 from 54.9 in February. Anything above 50.0 is positive, but analysts had forecast the New Orders Index to rise from February’s level. A year ago, the Index was comfortably above 60. After falling to just above 51 last fall, the rebound has so far topped well below the highs in early 2011.
 The ISM’s Nonmanufacturing Index dropped to 56 from its 12-month high of 57.3 in February. According to the Commerce Department, orders for Durable Goods fell 3.6% in January from their peak in December, but only rebounded 2.2% in February. After averaging more than 200,000 new jobs since December, job growth slowed to 120,000 in March. We suspect the labor market is healthier than the March report indicated. But the pattern in many of these reports is consistent with our assessment. The U.S. economy is beginning to roll over, after improving into early 2012. And, as we discussed last month, the annual and monthly seasonal adjustments likely boosted the actual level of economic activity in the fourth quarter and first quarter of this year.
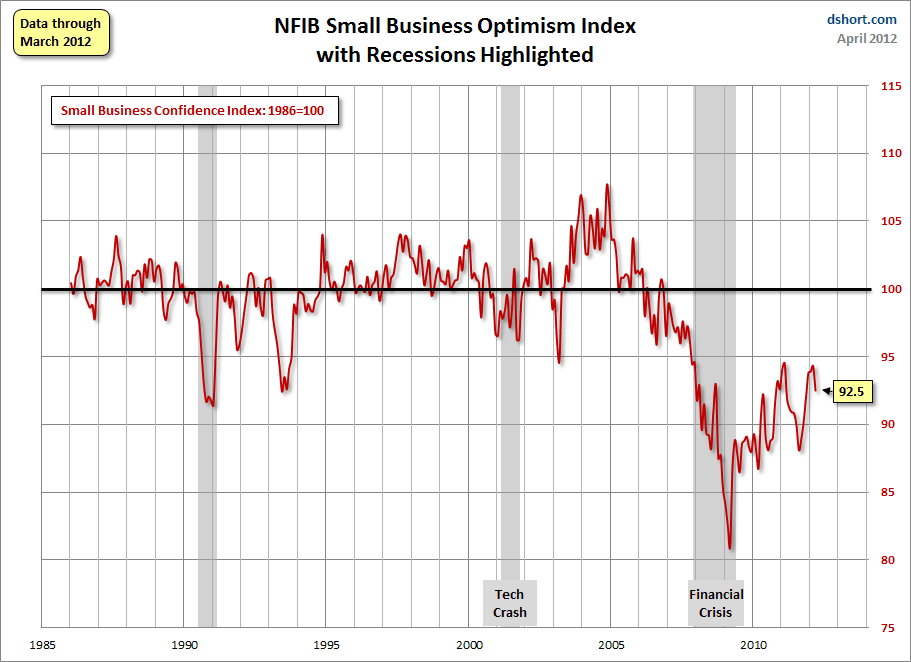 The big picture remains the same. Despite extraordinary monetary accommodation and fiscal stimulus, this recovery is the weakest of the eleven recoveries since World War II. Almost 4% of the labor force remains out of work. Consumer confidence is holding at levels only associated with recession during the last 35 years, based on the University of Michigan’s Consumer Sentiment Index. The National Federation of Independent Business’s Small Business Optimism Index is also at a level that has only occurred during recessions since 1985. Small business owners said their costs were rising and cited inflationary pressures as their number one problem. The second problem most often cited was s slowdown in sales, which is a reflection of weak job and income growth and low consumer confidence. As we have noted before, higher costs for energy and food are inflationary, but more deflationary since consumer incomes are rising less than the cost of living. The majority of consumers simply have less discretionary income, after paying up for essentials like food and energy.
We expect the U.S. economy to show more signs of slowing in coming months.
Federal Reserve
The Federal Reserve’s Ace in the Hole is QE3. They aren’t going to play that card, or even discuss it, until it’s needed. This is just common sense. And the Fed will launch Q3 if Europe falters as we expect and the U.S. economy starts to slide. The Federal Reserve is fully committed to making sure another recession does not develop, because the risk of a deflationary debt collapse is too large for the Fed not to do everything it can to prevent it from occurring.
In a recent interview on CNBC, Bill Gross, co-CEO of Pimco funds said, “When QE1 has ended, when QE2 has ended, basically the stock market has gone down by 1,500 points the next month or two. Is the Fed trapped in this conundrum of providing cheaper liquidity in order to pump up the stock market and risk markets? I think they are. I won’t argue . . . whether it’s good policy, but it’s necessarily policy based on where central banks have led us.” We don’t entirely agree with his assessment of why the stock market declined after QE1 and QE2 ended. On March 31, 2010, when QE1 ended, the S&P was 1173.27, and then the S&P rallied to 1219.80 on April 26, a gain of 3.96%. On May 6, the market suffered the Flash Crash, which had absolutely nothing to do with the end of QE1. The S&P rebounded from the Flash Crash low of 1065.79 on May 6 to 1173.57 on May 13. It then sold off as Greece ignited the first round of the European sovereign debt crisis, which also had nothing to do with the end of QE1. The S&P bottomed on July 1, 2010 at 1010.91. On June 30, 2011 QE2 ended, and by the end of July the second round of the European sovereign debt crisis erupted along with the downgrade of U.S. debt by Standard and Poors. The market sold off after the end of QE1 and QE2 because investors were provided good reasons to sell, not because of the end of the Fed’s QE programs. The perception that the end of the QE programs caused the stock market to decline is really based on the coincidence of subsequent events. The irony is that this perception, although false, can and likely will contribute to a stock market decline at some point.
Pumping up the stock market is part of the Fed’s game plan, since it increases wealth. The 33% decline in housing values, which has erased more than $6 trillion of wealth, can be partially offset by gains in the stock market. A higher stock market also boosts consumer spending, and that helps the economy. Our concern is that at some point everyone will realize that despite the quantitative easing programs (pick a number) the economy has still not achieved a self sustaining recovery. The risk of deflation will remain a constant companion for years.
Stocks
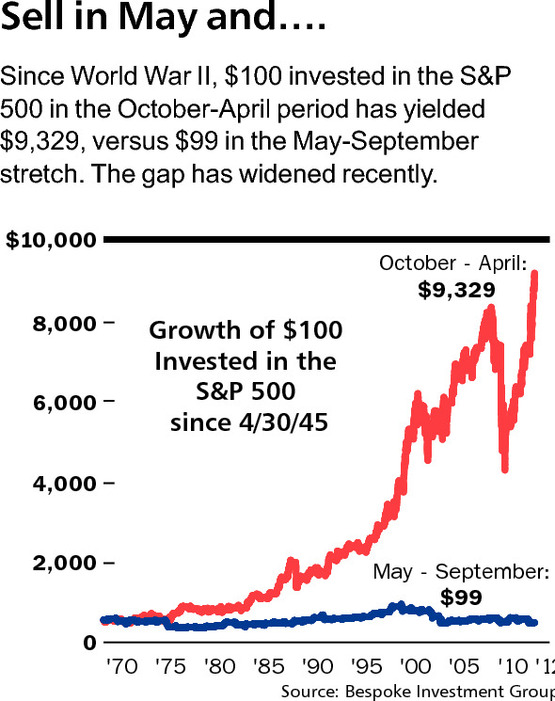 “Sell in May and go away” is an old Wall Street axiom that has gained traction, after working well in 2010 and especially last year. In fact, it has worked well for a long time. As the graphic shows, since World War II, a $100 investment in the S&P only in October-April of each year grew to $9,329, versus $99 in the May-September window of each year, according to Bespoke Investment Group. As natural contrarians we would be skeptical of it working for a third year in a row. However, if we’re right about Europe and a slowing U.S. economy, it is likely to work again this year. Investors don’t sell because of the calendar. They sell when incoming news doesn’t jibe with their positive outlook. The current consensus is that Europe will emerge from its shallow recession after mid-year, China will not experience a hard landing ever, and the U.S. will continue to grow largely unaffected by Europe anyway. Such a sanguine view is a good set up for disappointment in coming months.
In last months’ letter we wrote, “The rally from the low on March 5 is completing a 5 wave trading pattern from the December 20 low. The market is again ripe for a pullback of 4% to 7%, which could carry the S&P down to 1340-1350. If selling pressure does not pick up substantially on this pullback, we would expect the S&P to rally back to 1440-1449, which is where the S&P topped in May 2008.” The low on the recent decline was 1357.38 on April 10. Volume did expand on the selloff, and has not expanded during the rebound, which calls into question whether the market has the internal strength to run up to 1440-1449. Should the S&P manage to exceed its recent high of 1422, we would recommend becoming aggressively defensive. We will send out a Special Report if we see an opportunity to establish short positions as well.
Bonds
As we discussed last month, we don’t know if a secular turn in the bond market has occurred. Given our budget deficits and the fact we haven’t had a federal budget in three years, (what exactly are both parties doing in Washington) it’s easy to see why global investors might start questioning our resolve (lack of leadership) to address our budgetary largesse, and back away from Treasury bonds. However, we remain unconvinced the U.S. economy has achieved a sustained growth path and expect Europe’s debt problems to resurface, which should provide bonds a bid in coming months. Of course, not everyone agrees with our assessment. In March, Goldman Sachs published a 40 page report detailing why investors should say a ‘long good bye’ to bonds and embrace the ‘long good buy’ for stocks, since their global projections show the next decade is likely to be a peak period for global growth. While we give them style points for the cleverness of their phraseology, we think most of the next decade could be especially punk. The developed world, which currently represents more than 65% of global GDP, will continue to struggle under a mountain of debt and a need to reduce budget deficits with spending cuts. This is likely to keep GDP growth under 2% for the developed nations during the next several years at a minimum. China, the world’s second largest economy (and roughly 10% of global GDP), is undertaking a transformation of its economy from being primarily driven by exports and fixed investment, to one that is largely supported by domestic consumption. This transition will take almost a decade to fully accomplish, and will be accompanied by a few surprises along the way. We continue to believe the secular bear market in stocks that began in 2000 has another 3 to 5 years remaining before a new secular bull takes hold. And less than 5 years may prove optimistic.
In February, we recommended buying TLT in three stages, $117.23 (open on 2/24), at $113.91 after closing below $115.49, and below $112.85. The average is $114.66. We thought TLT could bounce back to $114.00 or higher in coming weeks. It reached $117.60 on April 16. Raise the stop from $108.50 to a close below $110.58. We think TLT will exceed $125.03 before year end.
Dollar
When Europe heats up, so will the Dollar. Raise the stop on the Dollar ETF UUP, from $21.70 to a close below $21.82.
Gold
A recent investment survey found that 37% of those asked favored gold, over any other investment. From a contrarian point of view this could be a big negative for gold. We also think there is gross misunderstanding of the expansion of central bank balance sheets. Many observers (and TV commercials) have concluded that central bank balance sheet expansion is the equivalent of printing money. It is not. If a large portion of the money sitting on central bank balance sheets was entering the economy through a surge in bank lending, it would have inflationary potential, as too much money chased too few goods. Currently, there is too little demand chasing too many goods in all the developed countries, while growth is slowing in China, Brazil, and India. In the U.S., the velocity of money is slowing dramatically. This is deflationary. At some point, gold will have a huge run, as it becomes the only currency of choice and the final investment bubble.
We still think a decline to $1525-$1550 is possible.
Macro Tides


