With the latest Case Shiller data out, look for the usual confusion between annual seasonal improvements and the regular
Case-Shiller:
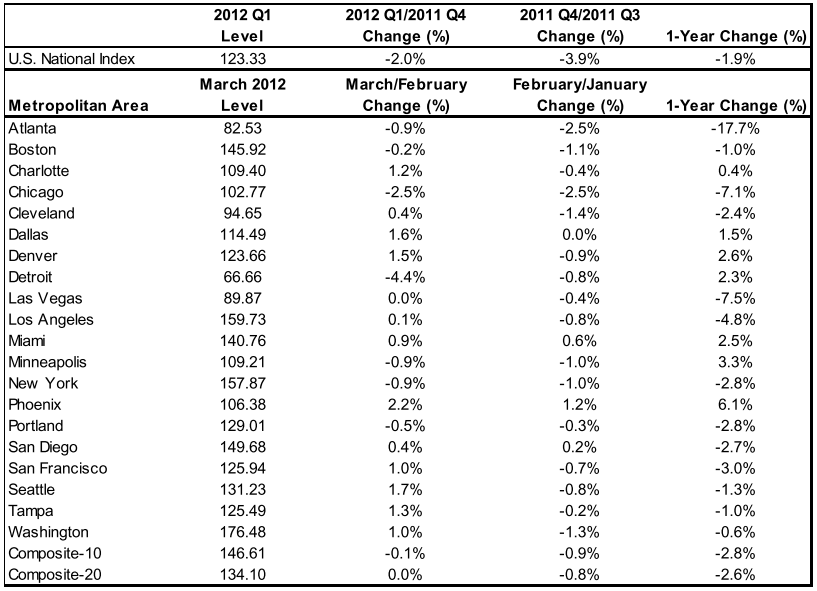
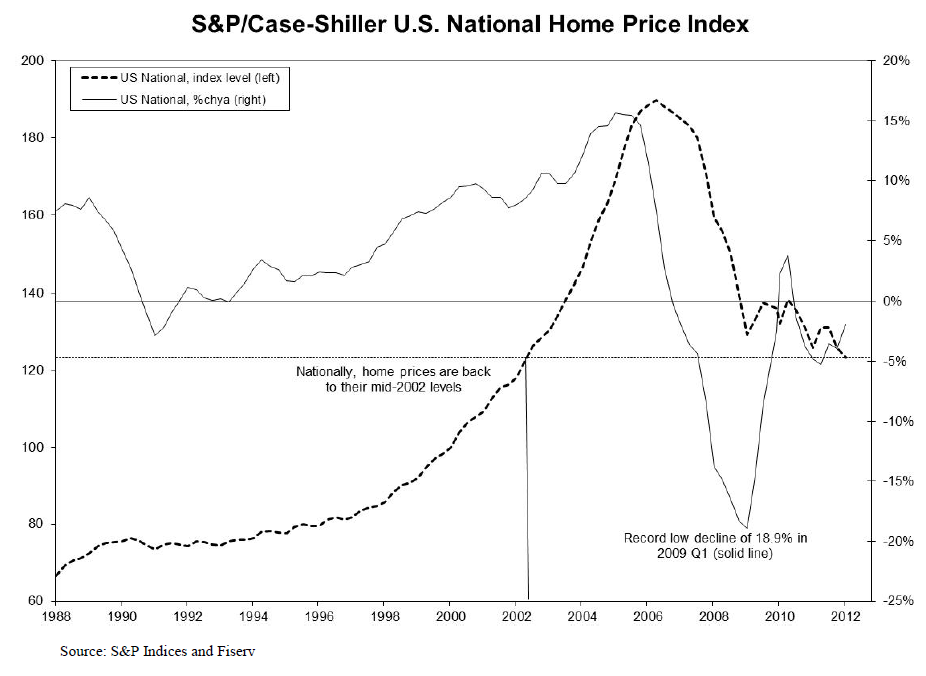
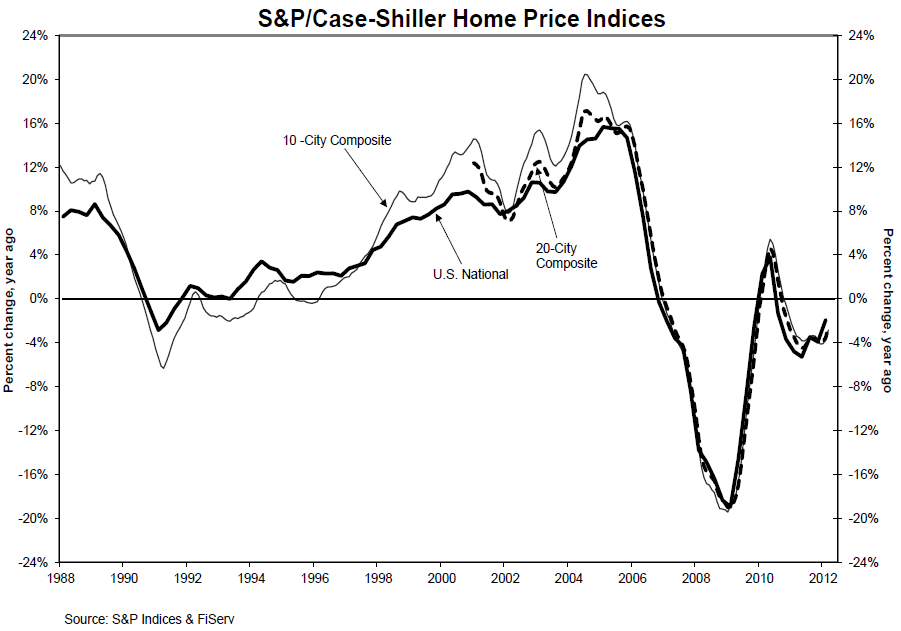
“Home Price Indices data through March 2012 showed that all three headline composites ended the first quarter of 2012 at new post-crisis lows. The national composite fell by 2.0% in the first quarter of 2012 and was down 1.9% versus the first quarter of 2011. The 10- and 20-City Composites posted respective annual returns of -2.8% and -2.6% in March 2012. Month-over-month, their changes were minimal; average home prices in the 10-City Composite fell by 0.1% compared to February and the 20-City remained basically unchanged in March over February. However, with these latest data, all three composites still posted their lowest levels since the housing crisis began in mid-2006.”
Note that the table of Metropolitan regions is still showing composite year iover year price decreases:
Source: S&P Indices and Fiserv
Data through March 2012
More charts after the jump
˜˜˜
Source: S&P Indices


What's been said:
Discussions found on the web: