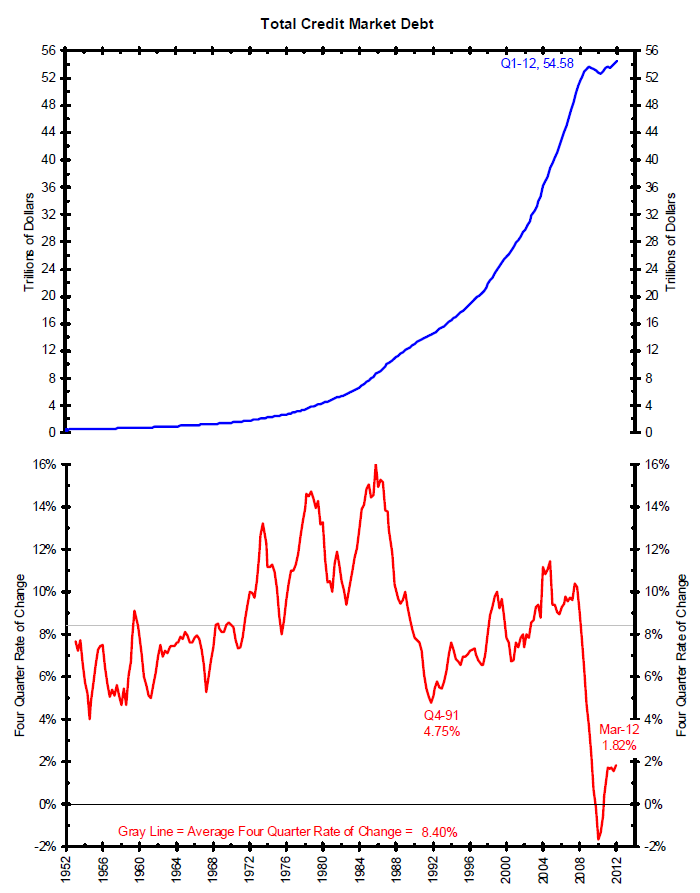
Marketwatch reported that U.S. debt load falling at fastest pace since 1950s. Since the recession ended in June 2009, total U.S. debt — Household, Corporate and Governmental — has risen at the slowest pace since record-keeping began in the early 1950s:
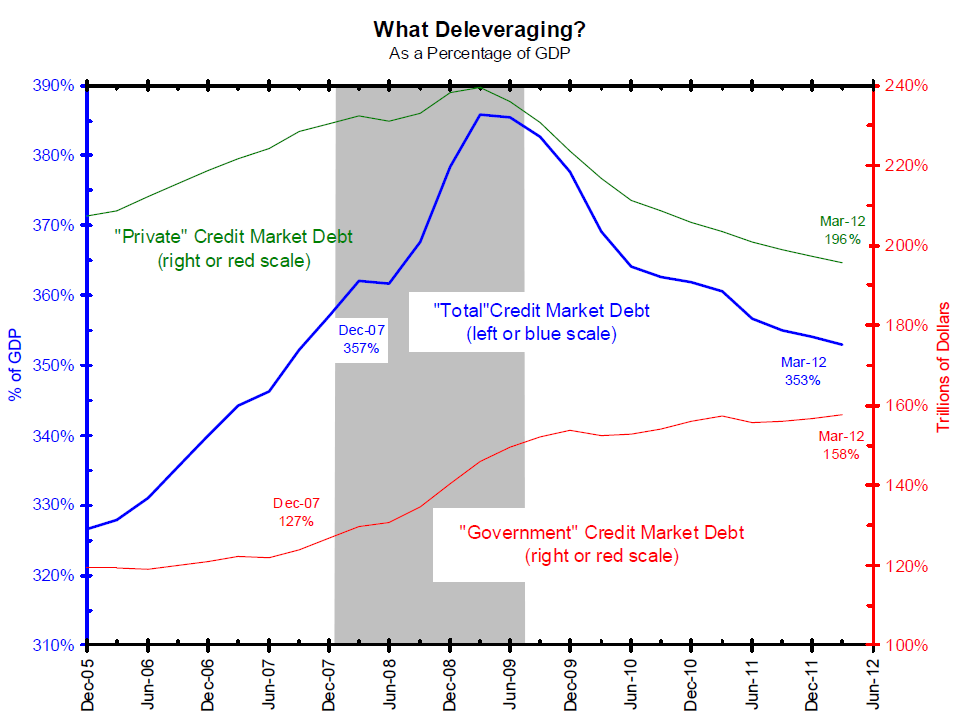
“As a share of the economy, debt has plunged as a consequence of rapid deleveraging by families, banks, nonfinancial businesses, and state and local governments. The ratio of total debt to gross domestic product has fallen from 3.73 times GDP to 3.36 times. In the 11 quarters since the recession officially ended, total domestic debt has risen by just $702 billion, or 1.4%. By contrast, in the 11 quarters before the recession began, in those bubble years of 2005, 2006 and 2007, total debt increased by $10.7 trillion, or 28%.”
While it is true that Washington has taken on a lot of debt since the recession ended, the private sector has paid off, written off or dumped on the government almost as much.
Hence, the net total debt is falling, as debt shifts from the private to the public sectors. As the chart below shows what the story above says, debt is growing slower than anytime since the 1950s (second panel).
As the chart below shows, debt to GDP has declined. However, as the chart title says, Does Anyone See Deleveraging? Private debt share of GDP is at its lowest level since 2004. Government debt to GDP is at a new high. Overall debt to GDP is at is lowest levels since 2007. Are these the levels that one would blow the all-clear signal? Is this why we had the worst recession since the great depression? To get back to the 2007 levels?
As the chart below shows, overall levels of debt are at new highs. This has been driven by a surge in government debt. Remind us again on how we can talk about deleveraging when overall debt levels are at new world records?
Source:
Chart Of The Week
June 13, 2012
Bianco Research


What's been said:
Discussions found on the web: