 Macro Factors and their impact on Monetary Policy,
the Economy, and Financial Markets
MacroTides.newsletter@gmail.com
Special Update – June 17, 2012
:
:
We have been traveling the last two weeks meeting with clients, so this month’s investment letter will be a little late. In the mean time . . .
“Will Sunday’s Greece Elections Prove to be a ‘Lehman Brothers Moment’? Maybe.
This headline caught our attention yesterday, since it is bound to raise the fear level of anyone reading it. We have thought Greece a sideshow, even though Greece will eventually leave the European Union, since it is in an untenable position. Greece is the current distraction from the far bigger somewhat intractable problems bearing down on Europe. There are too many countries in the EU that have too much debt and too little growth, which has been the case for years. This longer term imbalance has intensified, because Greece, Portugal, and Spain are in recession, which is driving up the costs of their social safety nets, while tax revenues plunge, causing budget deficits to remain high. Compounding the problem are the numerous insolvent banks in each country, which are being further weakened by the recession and falling asset prices. This has resulted in a sharp decline in lending, which only weakens the economy even more, as small and medium sized businesses are unable to access credit. This forces these firms to lay off workers, causing unemployment rates to rise and consumer incomes to fall, lessening the demand for goods and services. As demand declines, the recession becomes deeper, causing the cost of social safety nets to jump, and tax revenues fall. This is a classic vicious cycle, and to date, the policy makers in Europe have expertly managed to stay one step behind the curve, which has allowed this wave of economic destruction to gain momentum. Once it takes on a life of its own, they will be unable to stop it. We don’t know whether we have already reached this point of no return, but think the odds of it occurring are uncomfortably high and rising. We do not think another ‘Lehman Brothers Moment’ happens as a result of the Greek election. Too many are bracing for it, and more importantly, have had the time to adjust their portfolio accordingly. Markets are generally not so accommodating.
Policy makers in Europe, with the ECB and IMF, have cobbled a strategy to keep Greece, Portugal, and Spain afloat, with an approach that is almost certainly destined to bring them all down. As each of the weak country’s ship has sprung a leak, all the other countries in the E.U. have steered their ships to come along side those taking on water. With all hands on deck, the sailors on the Greek, Portugal, and Spaniard boats grab buckets and begin to bail water as fast as they can, passing their buckets to the sailors on all the other ships, who pour the water down into their ships hold. As the leaks in Greece, Portugal and Spain grow and they take on water even faster, the call goes out for bigger buckets, which, after a number of high level Summits, are requisitioned. Soon the sailors are bailing even more water into the holds of the healthy ships in the E.U., causing them to gradually sink lower too. So while most hold their breath waiting for the outcome of the Greek elections, we have to wonder if anyone is noticing the course the European policy makers have set is aimed at an iceberg of debt that grows with each new rescue package. Eventually Italy and even France my begin to take on water. By then, it will be almost impossible for everyone not to see the coming iceberg. When the siren sounds, it will be every country for itself, and it won’t be pretty.
Stocks
As noted, markets are rarely accommodating, and this may be one of those times. Most investors are very concerned with what’s going on in Europe, and the Greek election has the potential to be the straw that breaks the back of Europe’s financial system. What the markets are not positioned for is a relatively benign outcome in Greece’s election, or a mammoth response by global central banks that in the short run causes the stock market to rally sharply. We think this is the more likely outcome.
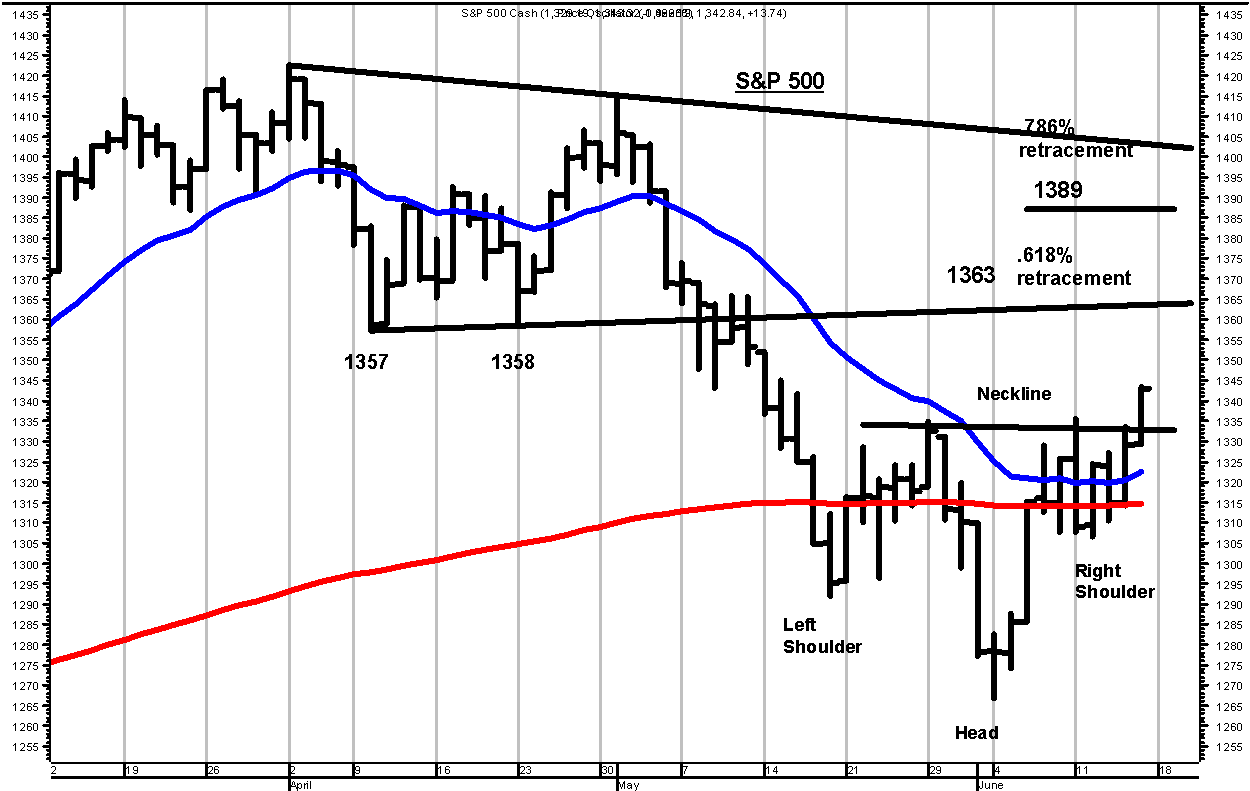
In the May 30 Special Update we wrote, “We think the S&P will fall below 1,292 and test the 200 day average near 1,282 soon. Our guess is that the S&P could find support between 1,265 and the 200 day average.” As it turned out, the S&P bottomed on June 4 at 1266.74. For the following discussion, please review the chart on the next page.
In a client meeting on June 5, we said we expected a rally, with the first upside target being 1335. On June 11, the S&P reached 1335.52, before pulling back to 1306.62 on June 12. In meetings on June 13 and June 14 with clients, we told them we expected the S&P to push above 1335, with the next target being 1357 – 1363, which is the .618% retracement level of the decline from the April 2 high of 1422, to the June 4 low at 1267. The S&P had a low on April 10 at 1357 and 1358 on April 23, so this area of 1357 to 1353 should represent some resistance.
The S&P also formed an inverted head and shoulders pattern (upside down head and shoulders) between May 16 and June 14. The distance between the head (low at 1267) and the neckline connecting the two shoulders at 1335 is 68 points. An upside target is measured by adding 68 points to the neckline at 1335, which projects to 1403. Interestingly, a trend line connected from the April 2 high at 1422 and 1415 on May 1 comes through right near 1403. The .786% retracement level of the decline from the April 2 high of 1422, to the June 4 low at 1267 is 1389. If the S&P drives above the area of resistance at 1357 – 1363, the next target would be 1389 – 1403. We think there is a decent chance the S&P will test this higher area of resistance, and potentially, in a short amount of time if the Greek election surprises. We would recommend doing some selling if the S&P reaches 1357 – 1363, and more aggressive selling if 1389 – 1403 is reached.
Conversely, the first warning our expected positive outcome is going awry will come if the S&P drops below 1320. A close below 1306 would suggest the rally is over, with new lows below 1267 to follow.
Bonds
In February, we recommended buying TLT in three stages: the open on 2/24 at $117.23, at $113.91 after closing below $115.49, and below $112.85. The average cost was $114.66. We thought TLT would exceed $125.03 before year end, as the European debt crisis intensified. In our May 22 letter, we recommended selling half if TLT traded above $124.45, which it did on May 23 for a gain of 8.45% on the half sold at $124.46. In our May 30 Special Update we recommended selling the remaining half if TLT reached $128.10. TLT reached $129.08 on May 31 and $130.38 on June 1. The gain on the second half of the position was 11.72%, for an overall gain of 10.08%. If the stock market rallies, the bond market is likely to sell off in the short run.
Dollar
In our May 2011 letter, we recommended going long the Dollar via its ETF (UUP) at $21.56, and in our July 31, 2011 Special Update, we suggested adding to the UUP position below $20.91. The average price is $21.24. The carrying charges associated with UUP, which we estimate to exceed 3% on an annual basis, have caused it to lag behind the cash dollar index far more than we expected. We still believe the cash dollar will eventually reach 89.00 – 92.00 at some point. The Dollar is likely to remain the least ugly girl at the dance, as the European crisis causes global investors to buy more Dollars. In our May 30 Special Update we suggested selling half if UUP traded above $23.00. It traded up to $23.02 on May 31, for a gain of 5.1%. Lower the stop to $22.35 from $22.40 on the remaining half position.
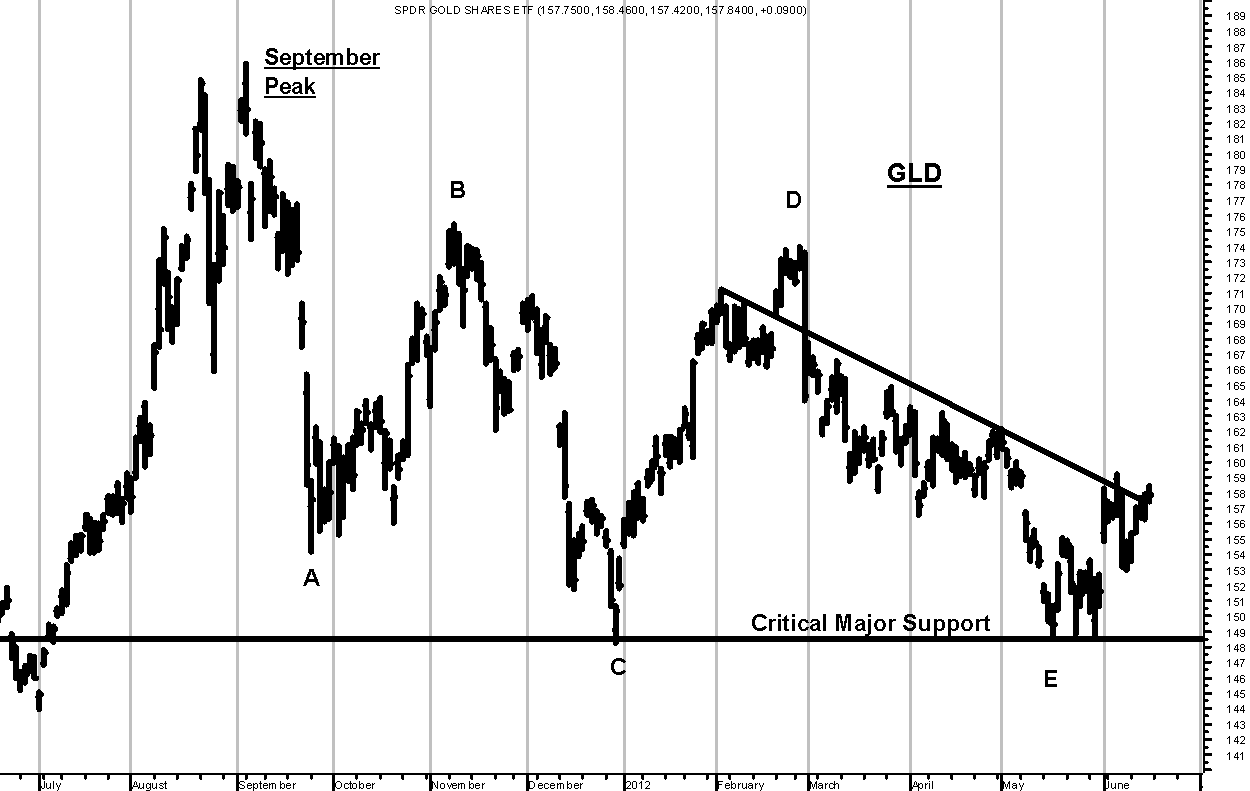
Gold
After pushing above $1900 last September, we felt Gold might finish the correction it began by declining to $1,525 – $1,550. On May 16 Gold dropped to $1,527, which may have completed a an A,B,C,D,E triangle pattern from last September’s high above $1,900. In our May 22 letter, we recommended establishing a 50% position in Gold via the ETF GLD on weakness. On May 23, GLD opened at $151.50, traded down to $148.84, before closing at $151.62. We used the mid-point of the range ($151.50-$148.84) at $150.17 as the entry. In our May 30 Special Update we recommended selling half of the position if GLD traded above $157.50. On June 1, GLD traded as high as $158.31, for a gain of 4.88% if sold at $157.50. Raise the stop on the remaining 25% position from $150.25 to $152.50. If GLD closes decisively below $148.50 for more than two days, and Gold below $1525.00, it would signal to us that the liquidity crisis in Europe was escalating.


