Matt Trivisonno looks at real time payroll withholding taxes on a year over year basis. He calls it the “greatest economic indicator of all time.”
The first chart shows that federal withholding-tax collections declined to an annual growth rate of 3.4% in the second quarter from a rate of 5.1% in the first quarter.
>
>
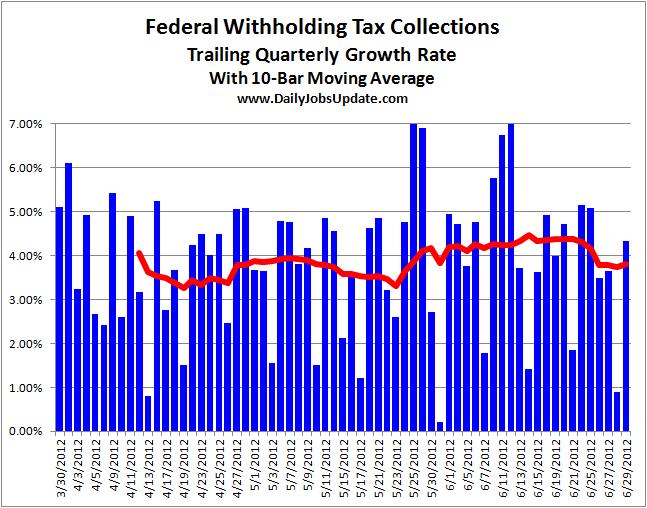
However, due to the way the calendar works, that deceleration is likely exaggerated. The second chart shows the second-derivative of the growth rate. It plots the Q/Q rate each day for the quarter ending on that date. And since the nature of the calendar causes this calculation to also be spiky, I have add a 10-bar moving average to smooth things out (red line).
>
>
So, as you can see, the true growth-rate looks to be steady at around 4%. That’s a respectable rate, though nothing to write home about.
We have seen a number of economic indicators portraying slowing-growth.
However, the withholding-tax data is not yet exhibiting any sign of job losses.
Note: The first two quarters of 2012 on the first chart look much stronger than those of 2011, but that is only because there was a big tax-cut in 2011.
Source:
Matt Trivisonno
DailyJobsUpdate


What's been said:
Discussions found on the web: