The Next 52 Weeks and the Case for Extremes Michael A. Gayed, CFA
Question 1: Since 1896, what would you think is the percentage of times the Dow Jones Industrial Average has risen or fallen by more than 30% over a rolling 52 week period?
Question 2: How confident are you in that percentage guess?
Overconfidence is a well known term used in the field of behavioral finance. The idea essentially is that people have a bias towards overestimating their knowledge, and get surprised more often than not because of having narrow confidence intervals. For example, traders tend to exhibit overconfidence in terms of their ability to “beat the average” even though overwhelming evidence shows the odds are vastly stacked against them. In the context of markets, overconfidence and having narrow confidence intervals over how equities themselves behave on both the up and the down side can lead to underestimation of both extreme up and extreme down moves.
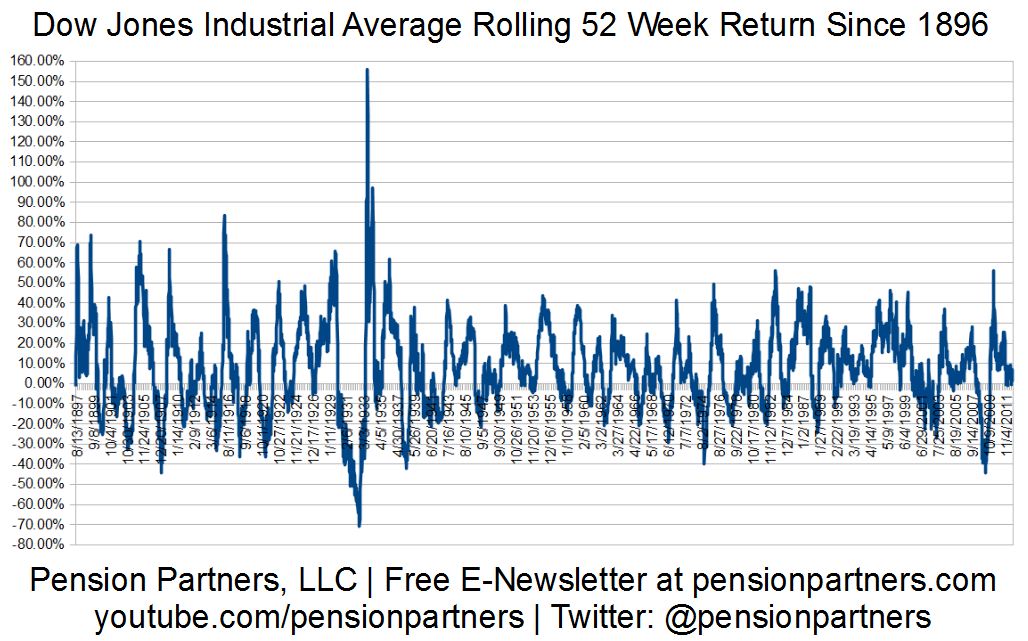
Having said all that, take a look below at a chart that plots a rolling 52 week return of the Dow Jones Industrial Average going all the way back to 1896. Essentially what this does is takes the prior 52 weeks worth of performance, plots that data point, and then continues forward in time to the next week, performing the same calculation all over again.
S&P 500 52-Week Rolling Returns
Click to enlarge:

There are a couple of interesting things to note here. First, markets can exhibit some wild movements over a rolling 52 week period. It was not uncommon in the pre-1940s era for the Dow to rally by 40/50/60%, or fall 20/30/40%, with the most extreme returns occurring during the Great Depression. For the bulk of the century, the Dow had numerous spurts of rolling 52 week performance which would hit up against the +40% mark, and fall about 20% on the downside (with the 1970s and 2008 crisis being the notable exceptions). Notice that generally the movements of one extreme are quickly countered time-wise by another extreme, as big moves up tend to over the next 52 weeks result in very fast big moves down.
Remember the answer you came up with to the first question asked at the beginning of this writing? The percentage of time that the Dow Jones Industrial Average over a rolling 52 week period has risen or fallen by more than 30%? The number is about 16% of the time historically. When turning positive at the 0% line, the average 52 week advance is 18.78%, with the median at 15.72%. When turning negative at the 0% line, the average is -14.06%, with the median at -11.32%.
So what happens in the next 52 weeks? After dropping to the 0% line, the Dow has held positive on the chart. Could the surprise be that resilience in the face of the negative narrative could cause a breaking away from the 0% magnet of the last few months, which in turn would suggest a period of big gains may yet be at our doorstep for stocks?
If you’ve followed any of my writings and approach towards intermarket analysis, you know where I stand…
~~~
Michael A. Gayed, CFA is Chief Investment Strategist at Pension Partners, where he structures portfolios. Prior to this role, Michael served as a Portfolio Manager for a large international investment group, trading long/short investment ideas in an effort to capture excess returns. In 2007, he launched his own long/short hedge fund, using various trading strategies focused on taking advantage of stock market anomalies. Michael earned his B.S. from New York University, and is a CFA Charterholder.


What's been said:
Discussions found on the web: