When…
1) rates drop by 30% YoY allowing the 70% of buyers who use a mortgage to ‘pay’ 15% more for a house on the same monthly payment;
2) foreclosures as a percentage of total sales drop 25% YoY lifting the “median” sale price:
3) and you comp YoY against a stimulus hangover year;
…’prices paid’ will ‘rise’ and ‘comps’ will look great. But the benefits of stimulus and easy comps will soon turn into headwinds and difficult comps, which is exactly what happened in 2011 following the year+ long home buyer tax credit stimulus pump of 2009/10. Once again, people are mistaking stimulus for durable fundamentals, which has been a consistent problem since housing’s first dead cat bounce on QE in 2009.
This morning Case-Shiller revealed one of the most known known’s in housing; that from 7 to 5 months ago (from Feb to April 2012) the price at which people ‘contracted’ to ‘pay’ for houses increased at the median YoY by ~1% from the severe hangover period from Feb to April 2011 when rates were 150-bps higher and foreclosures as a percentage of total sales 33% greater. Feb through April escrows with 30 to 60 closing periods would have closed from April through June and are now being reported at the end of August as something meaningful. It’s incredible really.
This is the first YoY ‘increase’ since the tax credit period of 2010 (not coincidentally) when purchasing power was also ratcheted higher on stimulus leverage due to 38 states allowing the monetization of the tax credit for down payment purposes through FHA.
If you remember, during this stimulus period leading up to the July 2010 sunset, headlines were filled with headlines such as “multiple offers return”; “house prices on the rise”; ”housing’s ‘v’ bottom” etc for months and months. With respect to today’s CS, the stimulus-goosed 1h’10 is this years best comp, as last year needs to be discounted as a stimulus hangover period.
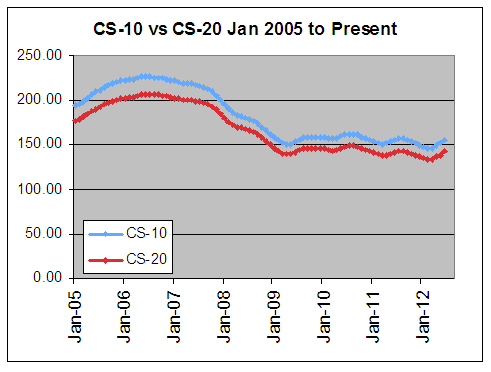
In sum, today’s CS is disappointing…a YoY 15% increase in purchasing power and 25% decrease in foreclosure resales and still the CS-20 NSA only managed a 0.5% gain over last year. To me, normalized, that means real house prices are still falling.
The chart below is the not-seasonally adjusted Case-Shiller 10 vs 20 indices. Anybody that can clearly see in these data a “durable bottom”, “escape velocity”, or a “recovery” is a lot better analyst than I.
Source: Mark Hanson
~~~
Mark Hanson is a mortgage banking veteran specializing in wholesale and correspondent sales, operations management. His primary focus was upon residential mortgages working closely with most mortgage and Wall Street investors. Since 2006 his primary focus has been upon his work as an independent real estate and finance sector analyst, consultant, and risk enlightener to the financial services sector.


What's been said:
Discussions found on the web: