As ETFs gain popularity as an investment vehicle for retail investors, we are often asked if we should shift our focus away from mutual fund flows in favor of ETF flows. At the very least, some argue, the flows out of mutual funds might be due to investors taking money out of mutual funds and investing in ETFs.
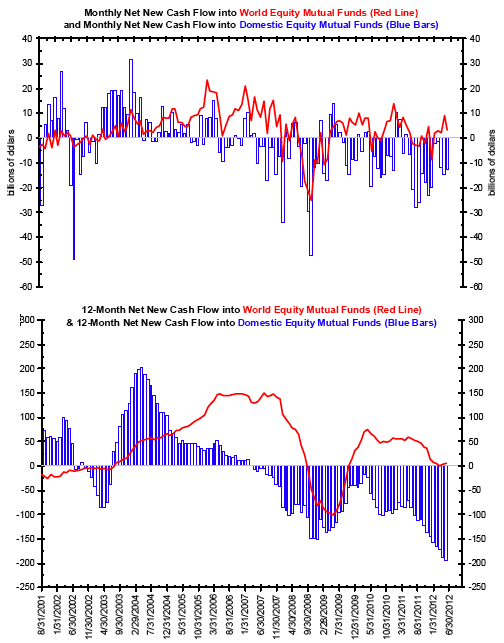
Regular readers will recognize the chart below highlighting data from the Investment Company Institute. The blue bars illustrate open-ended domestic equity mutual fund flows while the red line illustrates open- ended world equity mutual fund flows. Monthly sums are shown in the top panel with the 12-month rolling sums shown in the bottom panel.
As we have detailed in the past, investors correctly started selling domestic equity mutual funds on an annual basis in mid-2007 (blue bars, bottom panel). In fact, in the 12 months ending May 2012, net new cash flow out of these funds set a record at $193.93 billion. So how might these charts look if we were to add in ETF flows?
The chart below is identical in every way to the one above except that it includes ETF flows in addition to open- ended mutual fund flows. In general, the two charts look very similar. Some of the outflows seen in domestic equity mutual funds during the height of the crisis were offset by ETF flows. However, net new assets in all domestic equity funds still saw a record outflow in the year ending May 2012.
Although equity ETF flows have generally been positive in the face of declining equity mutual fund flows, they are not large enough to change the overall story being told by the data. Retail investors are still skeptical of U.S. equities and have been for many years.
Source:
by Bianco Research
Charts Of The Week
Pictures of Current Interest
For the week of July 25, 2012
~~~
For more information on this institutional research, please contact:
Max Konzelman
max.konzelman@arborresearch.com
800-606-1872


What's been said:
Discussions found on the web: