Comment
In the video above, Bloomberg talks about falling stock market volume. Generally they are correct, but we believe a clarification is in order.
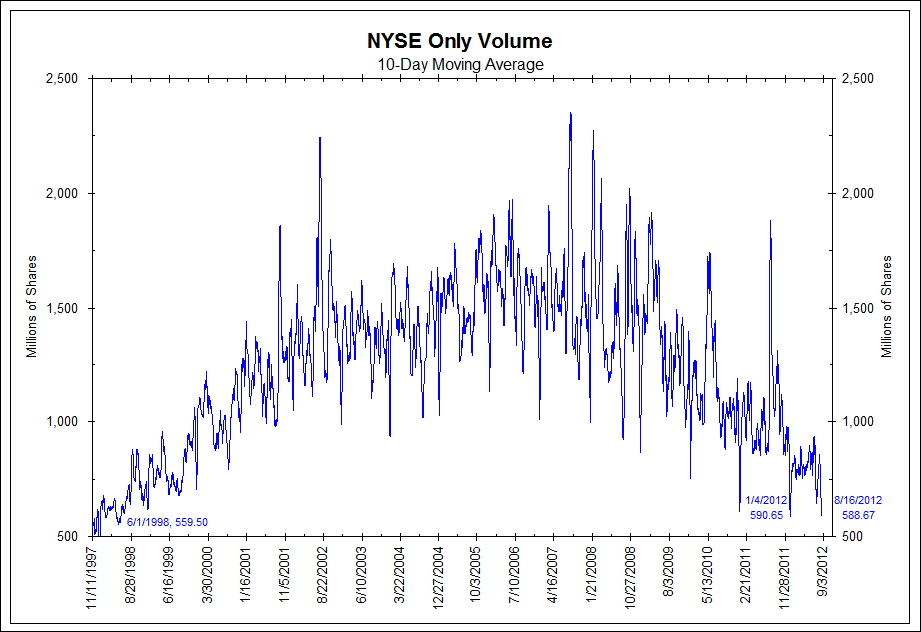
The chart below shows a version of what Bloomberg discussed, the 10-day moving average of NYSE-only volume. By this measure, the last 10 days of volume is at its lowest level since June 1998, including holiday weeks. NYSE volume is disappearing before our eyes!
This measure neglects the move away from the NYSE to other electronic exchanges, the playgrounds of high frequency traders (HFT).
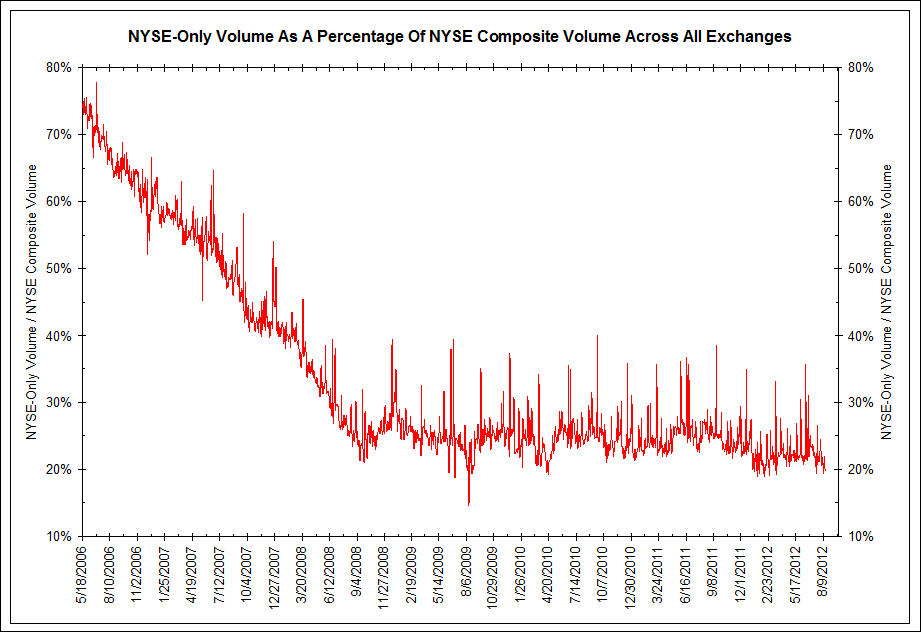
The next chart shows NYSE-only volume as a percentage of all volume in NYSE-listed stocks across all exchanges (known as composite volume). Prior to 2006, the percentage of NYSE-listed stocks trading on the NYSE was regularly above 80%. Since then, this percentage has dropped to less than 25% thanks to the demand for electronic trading by high frequency traders. Dozens of new electronic exchanges have been created to satiate this demand.
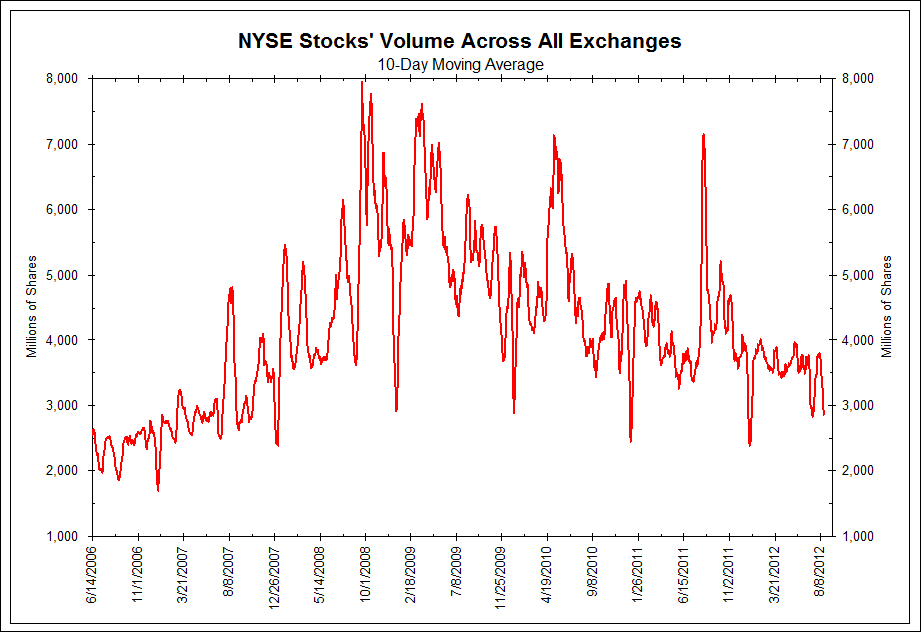
So, while composite volume is indeed down, it is not the epic collapse that NYSE-only volume suggests.
This does not mitigate the story that volume is dismal. It still is. But it highlights the move away from the NYSE in favor of electronic exchanges. And when one factors that up to 75% of daily volume is done by a computer with another computer, humans making capital asset allocation decisions are indeed becoming rare.
Bob Greifeld, the CEO of the NASDAQ, once referred to the floor of the NYSE as the “world’s most expensive TV set.” Given the NYSE’s 14-year low in volume, it’s hard to argue he is wrong.
Source: Bianco Research
~~~
For more information on this institutional research, please contact:
Max Konzelman
max.konzelman@arborresearch.com
800-606-1872


What's been said:
Discussions found on the web: