Source: Federal Reserve
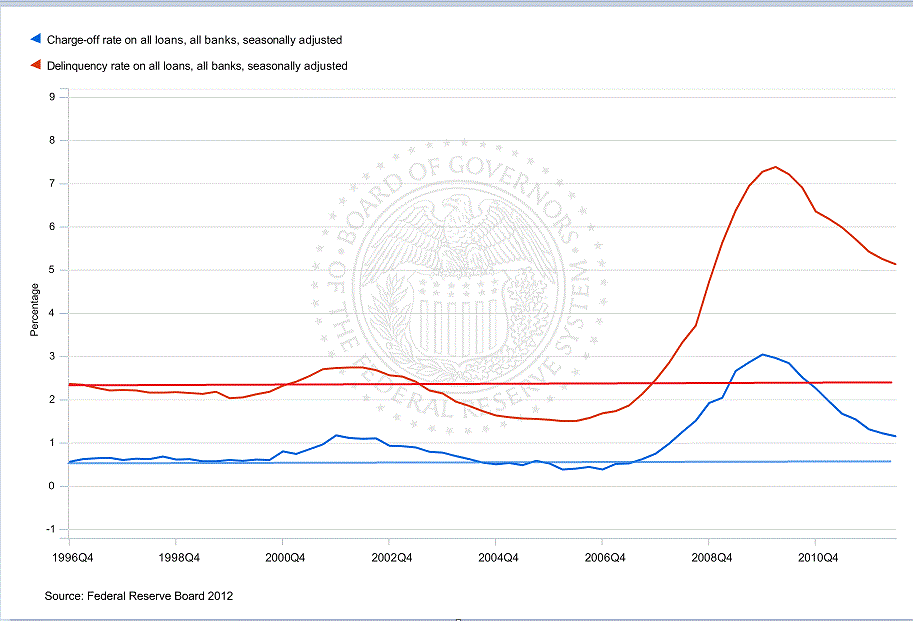
Interesting chart from the Fed showing the data on Delinquency Rates on all loans (including mortgages) and subsequent Charge-offs.
I added the horizontal red and blue lines, showing the approximate average over the past 15 years. As you can see, we are making progress on the charge offs. But we still have an enormous way to go in clearing the Delinquent Loans . . .
You can play with the interactive chart and data at the Federal Reserve site.


What's been said:
Discussions found on the web: