A Little Chronic Deflation
John Mauldin
October 13, 2012

One of the questions I (and other analysts) get asked most frequently is whether I think there is deflation or inflation in store for the US. My quick answer is “Yes.” A brief answer is that we are in a deflationary period and have been for over 30 years, but like all cycles it will come to an end. A great deal of the “when” depends on how the US deals with its deficit following the election. If we put the US on a realistic glide path to a balanced budget (over time) then that deflationary impulse will last longer than most observers think, even given QE3+++. If we do not deal with the issue, and try once again to kick the can to the next election, inflation could be a very real problem.
But one of the definitive experts on the question, and someone who has taught me a great deal over the years, is Dr. Gary Shilling, who has literally written the book (several, actually) on deflation. This week he summarizes a recent client letter for our Outside the Box, and I think you’ll will find stimulating. His is not the consensus view, but it’s one we need to understand.
You can subscribe to Gary Shilling’s Insight for the special introductory rate of $275 for Outside the Box readers (email delivery) and get a copy of the full Insight report excerpted here plus a copy of Gary’s latest book, Letting Off Steam, a collection of his commentaries on matters great and small, complex and mundane, serious and frivolous.
Gary will be writing about the details of who will be winners and losers in the Fed’s QE3 program, how overseas economies are faring, and what it all means for US stocks and the American economy. To subscribe to Insight call them at 888-346-7444 or 973-467-0070 and be sure to mention you read about the offer here.
This has been an interesting week. I was supposed to speak at a client meeting for Common Sense Investments at noon on Wednesday in Portland. Kyle Bass of Hayman Advisors was also speaking, so he graciously offered to let me fly with him in his plane rather than catching a redeye the night before. I got up early and made it to the hangar, but the plane had a mechanical problem. A quick call to American Airlines and a mad dash to the airport got me on a scheduled flight that would have gotten me in on time. Except that flight too had issues and the other flights were booked solid. An extremely helpful staff member at American somehow sorted it out and got me onto a full flight (with wifi!) and into Portland in time to let me give a speech as the “closer” for the day. Meanwhile, Kyle was in Chicago and found another way to get to Portland. The other speaker had a personal tragedy to deal with and couldn’t make it; so I called my old friend Ed Easterling, who lives not far from Portland, and he kicked the meeting off with his usual dynamic presentation while the rest of us figured out how to get there.
The next day, the founder of Common Sense Investments, Jim Bisenius, took us to his 36,000 acre ranch (and wildlife preserve) in Eastern Oregon to do a little hunting and fishing. It is a rather amazing place. He is such a gracious host and has a gift for getting people to tell their stories. Kyle brought along a young man who had been Special Operations in Iraq and who now carries around about four pounds of metal from a IED that can’t be gotten out of him. He’s in quite a lot of chronic pain but is rather cheerful and can tell some pretty amazing stories. It makes me humble to realize what sacrifices people make for our freedoms. The courage he and his brethren display on a regular basis is inspiring. I simply stand in awe and gratitude.
I was able to hitch a ride back to Dallas, got in late, got up the next morning, taped videos and read some emails, and then hopped another plane to Houston, where I am getting ready to go to my 40th Rice University class reunion. I am sure it will be another night of old friends and great stories, so I think I will hit the send button and go on to the party. Have a great week!
Your rather amazed at how much fun I get to have analyst,
(Even more amazing is that I get paid for this!)
John Mauldin, Editor
Outside the Box
subscribers@mauldineconomics.com
Seven Varieties of Deflation
By Dr. A. Gary Shilling
Inflation in the U.S. has historically been a wartime phenomenon, including not only shooting wars but also the Cold War and the War on Poverty. That’s when the federal government vastly overspends its income on top of a robust private economy—obviously not the case today when government stimulus isn’t even offsetting private sector weakness. Deflation reigns in peacetime, and I think it is again, with the end of the Iraq engagement and as the unwinding of Afghanistan expenditures further reduce military spending.
Chronic Deflation
Few agree with my forecast of chronic deflation. They’ve never seen anything but inflation in their business careers or lifetimes, so they think that’s the way God made the world. Few can remember much about the 1930s, the last time deflation reigned. Furthermore, we all tend to have inflation biases. When we pay higher prices, it’s because of the inflation devil himself, but lower prices are a result of our smart shopping and bargaining skills. Furthermore, we don’t calculate the quality-adjusted price declines that result from technological improvements in many big-ticket purchases. This is especially true since many of those items, like TVs, are bought so infrequently that we have no idea what we paid for the last one. But we sure remember the cost of gasoline on the last fill-up a week ago.
Doubts
Furthermore, many believe widespread deflation is impossible and that rampant inflation is assured in future years because of continuing high federal deficits, regardless of any long-run budget reform. And annual deficits of over $1 trillion are likely to persist in the remaining five to seven years of deleveraging, as I explain in my recent book, The Age of Deleveraging. The 2% annual real GDP growth I see persisting is well below the 3.3% needed to keep the unemployment rate stable. So to prevent high and chronically rising unemployment, any Administration and Congress—left, right or center—will be forced to spend a lot of money to create a lot of jobs.
But big federal deficits are inflationary only when they come on top of fully-employed economies and create excess demand. That’s obviously not true at present when large deficits are reactions to private sector weakness that has slashed tax revenues and encouraged deficit spending. Indeed, the slack in the economy in the face of persistent trillion dollar-plus deficits measures the huge size and scope of the offsetting deleveraging in the private sector, as noted earlier.
The deleveraging, especially in the global financial sector and among U.S. consumers, will be completed in another five to seven years at the rate it is progressing. At that point, the federal deficit should fade quickly, assuming a war or other cause of oversized government spending doesn’t intervene. The resumption of meaningful economic growth will reduce the pressure for economic stimuli and rising incomes and corporate profits will spur revenues. Serious work on the postwar baby-related bulge in Social Security and Medicare costs will also depress the deficit.
Good Deflation
A decade ago in my two Deflation books, I distinguished between two types of deflation—the Good Deflation of excess supply and the Bad Deflation of deficient demand. Good Deflation is the result of important new technologies that spike productivity and output even as the economy grows rapidly. Bad Deflation results from financial crises and deep recession, which hype unemployment and depress demand.
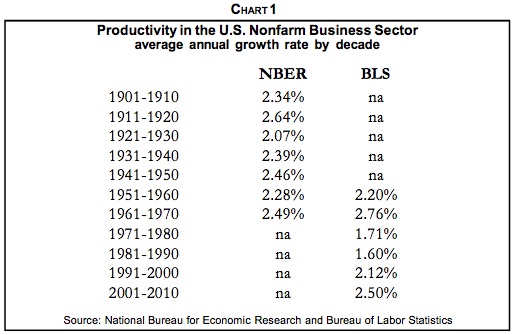
I’ve been forecasting chronic good deflation of excess supply because of today’s convergence of many significant productivity-soaked technologies such as semiconductors, computers, the Internet, telecom and biotech that should hype output. Ditto for the globalization of production and the other deflationary forces I’ve been discussing since I wrote the two Deflation books and The Age of Deleveraging. As a result of rapid productivity growth, fewer and fewer man-hours are needed to produce goods and services. The rapid productivity growth so far this decade is likely to persist (Chart 1).
While I’ve consistently predicted the good deflation of excess supply, I said clearly that the bad deflation of deficient demand could occur—due to severe and widespread financial crises or due to global protectionism. Both are now clear threats.
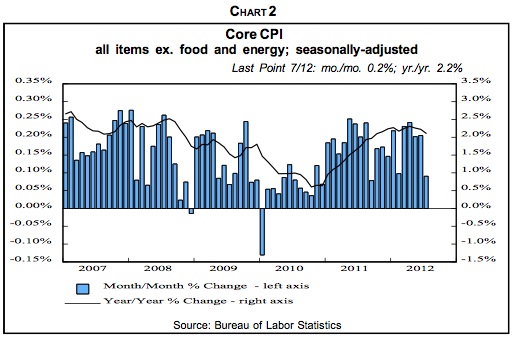
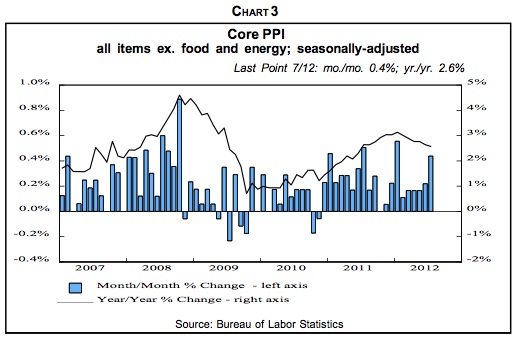
My forecast is that the unfolding global slump will initiate worldwide chronic deflation. A number of indicators point in that direction. Sure, much of the recent weakness in the PPI and CPI has been due to falling energy and food prices. Excluding these volatile items, prices are still rising but at slowing rates (Charts 2 and 3). Consumer price inflation is also falling abroad in the U.K. and the eurozone.
After China’s huge stimulus program in 2009 in response to the global recession and nosedive in exports to U.S. consumers, the economy revived, but so did inflation. Double-digit food price jumps were especially troublesome in a land where many live at subsistence levels. So in response to the surge in inflation and the real estate bubble, Chinese leaders tightened economic policy, driving down CPI inflation to a 2.0% rise in August vs. a year earlier. But, in conjunction with the weakening in export growth, that is pushing China toward a hard landing of 5% to 6% economic growth, well below the 7% to 8% needed to maintain stability.
Back in the States, inflationary expectations, as measured by the spread between 10-year Treasury yields and the yield on comparable Treasury Inflation-Protected Securities are narrowing.
Other Varieties
Besides rises or falls in general price levels, which most think about when they hear “inflation” or “deflation,” there are six other varieties, maybe more.
Commodity Inflation/Deflation. In the late 1960s, the mushrooming costs of the Vietnam War and the Great Society programs in an already-robust economy created a tremendous gap between supply and demand in many areas. The history of low inflation rates for goods and services, we’ll call it CPI inflation for short, in the late 1950s and early 1960s, apparently created a momentum of low price advances that kept CPI inflation from exploding until about 1973. But by the early 1970s, commodity prices started to leap and spawned a self-feeding up surge. Worried that they’d run out of critical materials in a robust economy, producers started to double and triple order supplies to insure adequate inventories. That hyped demand, which squeezed supply, and prices spiked further. That spawned even more frenzied buying as many expected shortages to last forever.
At the time, even before the 1973 oil embargo, I was lucky enough to realize that what was occurring was not perennial shortages but massive inventory-building. I found a parallel in post-World War I when wartime price and wage controls were removed and wholesale prices skyrocketed about 30% in one year as double and triple ordering hyped inventories amid frenzied demand and fears of shortages. Then all those inventories arrived and sired the 1920-1921 recession, the sharpest on record, and wholesale prices collapsed. Armed with this history, I correctly forecast the 1973-1975 recession and said it would be the worst since the 1930s, which it proved to be. Arriving inventories swamped production, especially in late 1974 and early 1975, so production nosedived.
Another Commodity Bubble
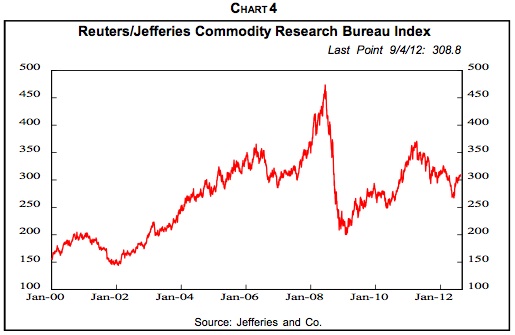
It’s probably no coincidence that China’s joining the World Trade Organization at the end of 2001 was followed by the commencement of another global commodity price bubble that started in early 2002 (Chart 4). And it has been a bubble, in my judgment, based on the conviction that China would continue to absorb huge shares of the world’s industrial and agricultural commodities. The shift of global manufacturing toward China magnified her commodity usage as, for example, iron ore that previously was processed into steel in the U.S. or Europe was sent to China instead.
Peak Oil
Crude oil has been the darling of the commodity-shortage crowd, and when its price rose to $145 per barrel in July 2008, many became convinced that the world would soon run out of oil.
But they discounted the fact that reserves are often underestimated since oil fields produce more than original conservative estimates. Nor did they expect conventional and shale natural gas, liquefied natural gas, the oil sands in Canada, heavy oil in Venezuela and elsewhere, oil shale, coal, hydroelectric power, nuclear energy, wind, geothermic, solar, tidal, ethanol and biomass energy, fuel cells, etc. to substitute significantly for petroleum.
Recent Weakness
The weakness in commodity prices, starting in early 2011, no doubt has been anticipating both a hard landing in China and a global recession. In my view, the foundation of the decade-long commodity bubble is crumbling, and the unfolding of a hard landing in China and worldwide recession will depress commodity prices considerably, even from current levels, as disillusionment replaces investor enthusiasm.
Wage-Price Inflation/Deflation. A second variety of inflation is a particularly virulent form, wage-price inflation in which wages push up prices, which then push up wages in a self-reinforcing cycle that can get deeply and stubbornly embedded in the economy. This, too, was suffered in the 1970s and accompanied slow growth. Hence the name, stagflation. As with commodity inflation, it was spawned by excess aggregate demand resulting from huge spending and the Vietnam War and Great Society programs on top of a robust economy.
Back then, labor unions had considerable bargaining strength and membership. Furthermore, American business was relatively paternalist, with many business leaders convinced they had a moral duty to keep their employees at least abreast of inflation. Most didn’t realize that, as a result, inflation was very effectively transferring their profits to labor. And also to government, which taxed underdepreciation and inventory profits. The result was a collapse in corporate profits’ share of national income and a comparable rise in the share going to employee compensation from the mid-1960s until the early 1980s.
The Peak
The wage-price spiral peaked in the early 1980s as CPI inflation began a downtrend that has continued. Voters rebelled against Washington, elected Ronald Reagan and initiated an era of government retrenchment. The percentage of Americans who depend in a significant way on income from government rose from 28.7% in 1950 to 61.2% in 1980, but then fell to 53.7% in 2000. Furthermore, the Fed, under then-Chairman Paul Volcker, blasted up interest rates, and negative real borrowing costs turned to very high positive levels.
As inflation receded, American business found itself naked as the proverbial jaybird with depressed profits and intense foreign competition. In response, corporate leaders turned to restructuring with a will. That included the end of paternalism towards employees as executives realized they were in a globalized atmosphere of excess supply of almost everything. With operations and jobs moving to cheaper locations offshore and with the economy increasingly high tech and service oriented, union membership and power plummeted, especially in the private sector.
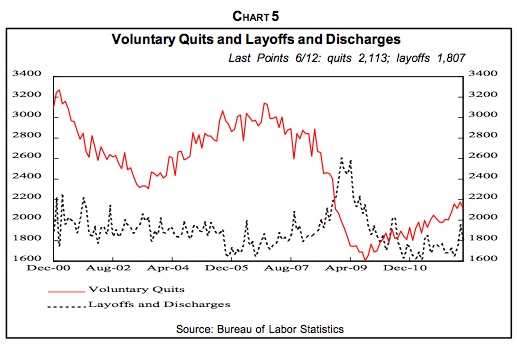
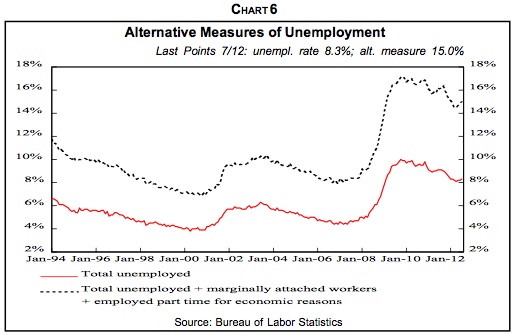
In today’s unfolding deflation, the wage-price spiral has been reversed. Contrary to most forecaster expectations, but forecast in my two Deflation books, wages are actually being cut and involuntary furloughs instituted for the first time since the 1930s. In inflation, oversized wages can be cut to size by simply avoiding pay hikes while inflation erodes real compensation to the proper level. But with deflation, actual cuts in nominal pay are necessary. Note that as wage cuts and furloughs become increasingly prevalent, the layoff (Chart 5) and unemployment numbers (Chart 6) will increasingly understate the reality of the declines in labor compensation.
Financial Asset Inflation/Deflation. Perhaps the best recent example of financial asset inflation was the dot com blowoff in the late 1990s. It culminated the long secular bull market that started in 1982 and was driven by the convergence of a number of stimulative factors. CPI inflation peaked in 1980 and declined throughout the 1980s and 1990s. That pushed down interest rates and pushed up P/Es. American business restructured and productivity leaped.
A Secular Down Cycle
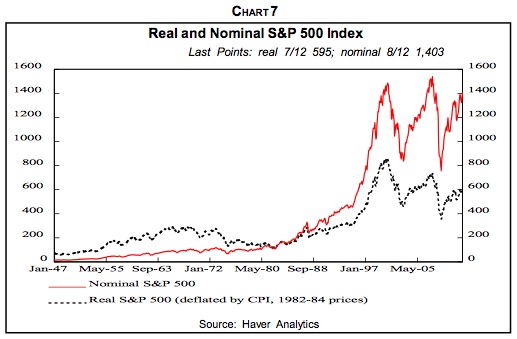
The robust economy upswing that drove the 1982-2000 secular bull market ended in 2000, as shown by basic measures of the economy’s health. Stocks, which gauge economic health as well as fundamental sentiment, have been trending down since 2000 in real terms (Chart 7). At the rate that deleveraging worldwide is progressing, it will take another five to seven years to be completed with equity prices continuing weak on balance during that time. Employment also peaked out in 2000 even after accounting for lower although rising labor participation rates by older Americans. Household net worth in relation to disposable (after-tax) income has also been weak for a decade.
The Federal Reserve’s Survey of Consumer Finances, just published for 2007-2010, reveals that median net worth of families fell 39% in those years from $126,400 to $77,300, largely due to the collapse in house prices. Average household income fell 11% from $88,300 to $78,500 in those years with the middle-class hit the hardest. The top 10% by net worth had a 1.4% drop in median income, the lowest quartile lost 3.7% but the second quartile was down 12.1% and the third quartile dropped 7.7%.
Households reacted to too much debt by reducing it. In 2010, 75% of households had some debt, down from 77% in 2007, according to the Fed survey. Those with credit card balances fell from 46.1% to 39.4% but late debt payments were reported by 10.8% of households, up from 7.1% in 2007. With house prices collapsing, debt as a percentage of assets climbed to 16.4% in 2010 from 14.8% in 2007. Financial strains reduced the percentage that saved in the preceding year from 56.4% in 2007 to 52% in 2010.
Nevertheless, the gigantic policy ease in Washington in response to the stock market collapse and 9/11 gave the illusion that all was well and that the growth trend had resumed. The Fed rapidly cut its target rate from 6.5% to 1% and held it there for 12 months to provide more-than ample monetary stimulus. Meanwhile, federal tax rebates and repeated tax cuts generated oceans of fiscal stimulus as did spending on homeland security, Afghanistan and then Iraq.
As a result, the speculative investment climate spawned by the dot com nonsense survived. It simply shifted from stocks to commodities, foreign currencies, emerging market equities and debt, hedge funds, private equity—and especially to housing. Homeownership additionally benefited from low mortgage rates, loose lending practices, securitization of mortgages, government programs to encourage home ownership and especially to the conviction that house prices would never fall.
Investors still believed they deserved double-digit returns each and every year, and if stocks no longer did the job, other investment vehicles would. This prolongs what I have dubbed the Great Disconnect between the real world of goods and services and the speculative world of financial assets.
Treasurys
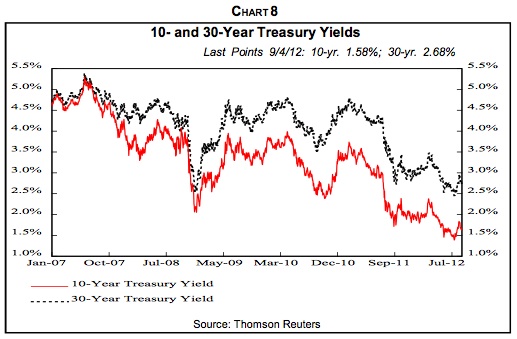
I hope you’ll recall my audacious forecast of 2.5% yields on 30-year Treasury bonds and 1.5% on 10-year Treasury notes, made at the end of last year when the 30-year yield was 3.0%. Those levels were actually reached recently (Chart 8), and I now believe the yields will fall to 2.0% and 1.0%, respectively, for the same reasons that inspired my earlier forecasts. The global recession will attract money to Treasurys as will deflation and their safe-haven status. Sure, Treasurys were downgraded by Standard & Poor’s last year, but in the global setting, they’re the best of a bad lot.
The deflation in interest rates has spawned significant side effects. It’s a zeal for yield that has pushed many individual and institutional investors further out on the risk spectrum than they may realize. Witness the rush into junk bonds and emerging country debt. Recently, investors have jumped into the government bonds of Eastern European countries such as Poland, Hungary and Turkey where yields are much higher than in developed lands. The yield on 10-year notes in Turkish lira is about 8% compared to 1.4% in Germany and 1.6% in the U.S.
The inflows of foreign money has pushed up the value of those countries’ currencies, adding to foreign investor returns. And some of these economies look solid relative to the troubled eurozone—Poland avoided recession in the 2008-2009 global financial crisis. But the continuing eurozone financial woes and recession may well drag the zone’s Eastern European trading partners down. And then, as foreign investors flee and their central banks cut rates, their currencies will nosedive much as occurred in Brazil.
Tangible Asset Inflation/Deflation. Booms and busts in tangible asset prices are a fourth form of inflation/deflation. The big inflation in commercial real estate in the early 1980s was spurred by very beneficial tax law changes earlier in the decade and by financial deregulation that allowed naïve savings and loans to make commercial real estate loans for the first time. But deflation set in during the decade due to overbuilding and the 1986 tax law constrictions. Bad loans mounted and the S&L industry, which had belatedly entered commercial real estate financing, went bust and had to be bailed out by taxpayers through the Resolution Trust Corp.
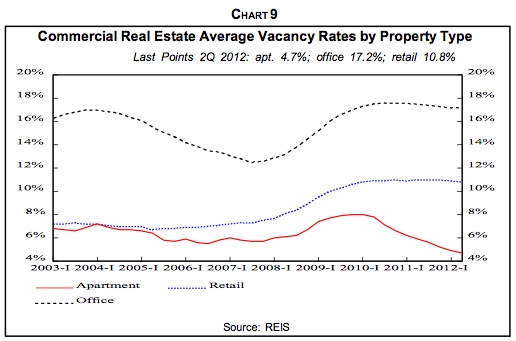
Nonresidential structures, along with other real estate, were hard hit by the Great Recession and remain weak as capacity remains ample and prices of commercial real estate generally persist well below the 2007 peak. The two obvious exceptions are rental apartments and medical office buildings. Returns on property investments recovered from the 2007-2009 collapse, but are now slipping.
Retail vacancy rates remain high (Chart 9) due to cautious consumers and growing online sales. Rents remain about flat. Ditto for office vacancies due to weak employment and the tendency of employers to move in the partitions to pack more people into smaller office spaces. The office vacancy rate in the second quarter was 17.2%, the same as the first quarter, down slightly from the post-financial crisis peak of 17.6% in the third quarter of 2010 but well above the 2007 boom level of 13.8%. In the second quarter, office space occupancy rose just 0.12% from the previous quarter compared to 0.18% in the first quarter.
Housing Woes
House prices have been deflating for six years, with more to go (Chart 10). The earlier housing boom was driven by ample loans and low interest rates, loose and almost non-existent lending standards, securitization of mortgages which passed seemingly creditworthy but in reality toxic assets on to often unsuspecting buyers, and most of all, by the conviction that house prices never decline.
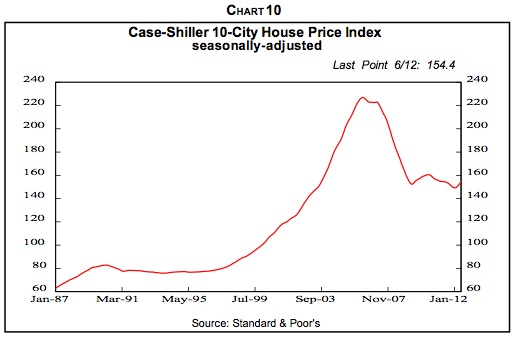
I expect another 20% decline in single-family median house prices and, consequently, big problems in residential mortgages and related construction loans. In making the case for continuing housing weakness, I’ve persistently hammered home the ongoing negative effect of excess inventories on house sales, prices, new construction and just about every other aspect of residential real estate.
Spreading Effects
That further drop would have devastating effects. The average homeowner with a mortgage has already seen his equity drop from almost 50% in the early 1980s to 20.5% due to home equity withdrawal and falling prices. Another 20% price decline would push homeowner equity into single digits with few mortgagors having any appreciable equity left. It also would boost the percentage of mortgages that are under water, i.e., with mortgage principals that exceed the house’s value, from the current 24% to 40%, according to my calculations. The negative effects on consumer spending would be substantial. So would the negative effects on household net worth, which already, in relation to after-tax income, is lower than in the 1950s.
Currency inflation/deflation. We all normally talk about currency devaluation or appreciation. This is, however, another type of inflation/deflation and like all the others, it has widespread ramifications. Relative currency values are influenced by differing monetary and fiscal policies, CPI inflation/deflation rates, interest rates, economic growth rates, import and export markets, safe haven attractiveness, capital and financial investment opportunities, attractiveness as trading currencies, and government interventions and jawboning, among other factors. In recent years, Japan, South Korea, China and Switzerland have all acted to keep their currencies from rising to support their exports and limit imports.
The U.S. dollar has been strong of late, resulting from its safe haven status in the global financial crisis. Furthermore, the U.S. economy, while slipping, is in better shape than almost any other—the best of the bunch. I believe the global recession will persist and the greenback will continue to serve this role. Furthermore, the greenback is likely to remain strong against other currencies for years as it continues to be the primary international trading and reserve currency. The dollar should continue to meet at least five of my six criteria for being the dominant global currency:
1. After deleveraging is complete, the U.S. will return to rapid growth in the economy and in GDP per capita, driven by robust productivity.
2. The American economy is large and likely to remain the world’s biggest for decades.
3. The U.S. has deep and broad financial markets.
4. America has free and open financial markets and economy.
5. No likely substitute for the dollar on the global stage is in sight.
6. Credibility in the buck has been in decline since 1985, but may revive if long-run government deficits are addressed and consumer retrenchment and other factors shrink the foreign trade and current account deficits.
Inflation By Fiat. Way back in 1977, I developed the Inflation by Fiat concept, which gained media attention in that era of high wage-price inflation. This seventh form of inflation encompassed all those ways by which, with the stroke of a pen, Congress, the Administration and regulators raise prices.
The continual rises in the minimum wage is a case in point. So, too, are high tariffs on imported Chinese tires. Agricultural price supports keep prices above equilibrium. As a result, the producer price of sugar in the U.S. is 28 cents per pound compared to the 19 cents world price. Federal contractors are required to pay union wages, which almost always exceed nonunion pay, as noted earlier, another example of inflation by fiat.
Environmental protection regulations may improve the climate, but they increase costs that tend to be passed on in higher prices. The Administration says its new fuel-economy standards of 54.5 miles per gallon by 2025 will cost $1,800 per vehicle but industry estimates put it at $3,000. The cap and trade proposal to reduce carbon emissions is estimated to cost each American household $1,600 per year, according to the Congressional Budget Office. Pay hikes for government workers must be paid in higher taxes sooner or later, and can spill over into private wage increases—although state and local government employee pay is moving back toward private levels, as discussed earlier. Increases in Social Security taxes raise employer costs, which they try to pass on in higher selling prices.
There was some deflation by fiat in the 1980s and 1990s. One of the biggest changes was requiring welfare recipients to work or be in job-training programs. That reduced the welfare rolls from 4.7% of the population in 1980 to 2.1% in 2000, while the overall number that depended on government for meaningful income dropped from 61.2% to 53.7%. But now, as an angry nation and left-leaning Congress and Administration react to the financial collapse, Wall Street misdeeds and the worst recession since the Great Depression, the increases in government regulation and involvement in the economy have been substantial. And with them, more inflation by fiat—at least unless there is a major change of government control with the November elections.
(Excerpted from Gary Shilling’s INSIGHT newsletter. For more information, visit www.agaryshilling.com)


What's been said:
Discussions found on the web: