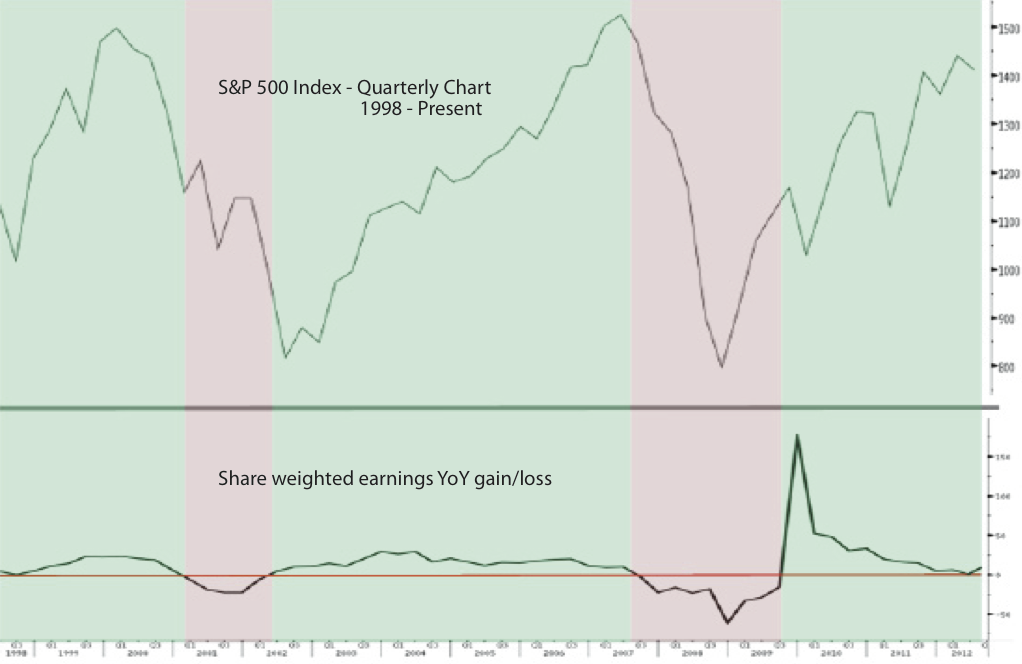
S&P 500 Index with Share Weighted Earnings Average YoY Gain/Loss
From Fusion’s Kevin Lane:
“The lower chart panel at bottom tracks the share weighted average earnings (gain or loss) for each quarter on a YoY basis for S&P 500 Index companies.
For instance, @ present, with a bit more the 1⁄2 the companies reporting, S&P 500 earnings YoY (on a share weighted basis) are only up 3.3 %. The shaded green blocks show areas where YoY share weighted earnings were positive (> 0 %), while the red shaded blocks show areas where YoY share weighted S&P 500 earnings were negative (< 0%). Note the red areas were 2001-2002 and 2007,2007 and into 2009, all challenging times for the market (2009 portion). That said, we are very close to tilting back into the negative zone, though we suspect a majority of S&P 500 poor earnings are out of the way, paving the way for this number to improve a bit. However given its proximity to negative YoY territory we have to remain vigilant, especially with market technicals weaker of late.”


