Led by the ugly correction in Apple and Google’s 10 percent swan dive after its earnings release, the Nasdaq has broken its uptrend and key support at around 3040, which has held since mid-August. The index managed to close on Friday just above its 100-day moving average.
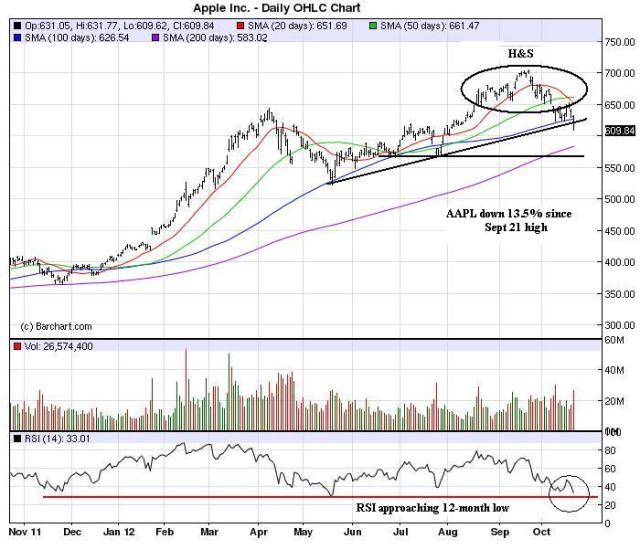
Apple’s earnings release on Thursday will be the key factor in determining the Nasdaq’s near term direction. Unlike Google, which had run up almost 40 percent since its last earnings report, Apple is in the middle of a pretty nasty correction, down over 13 percent from its Sept 21 high of 705.07.
The stock broke key support at 623 on Friday and it looks ready to test the 200-day moving average at around $583, about 4 ½ percent lower. Apple’s RSI is approaching a 12-month low and is setting up for a nice pop going into earnings. If the stock continues trade sloppy on decent earnings and revenue, ” Cupertino, we have a problem!”
This has been a year of the bear trap and the many of the ugliest technical and oversold stocks/indices/currencies have tended to reverse and give facials to all but the most nimble of traders. Last Monday, for example, Japan’s NIKKEI looked ugly and ready to break to new lows only to reverse and trade 5 ½ percent higher for the week.
Will this continue? We have no freaking idea and are just trying live by the 11th commandment:
Those who remain flexible shall not be broken (i.e., go broke).
Discipline trumps conviction!
(click here if charts are not observable)


What's been said:
Discussions found on the web: