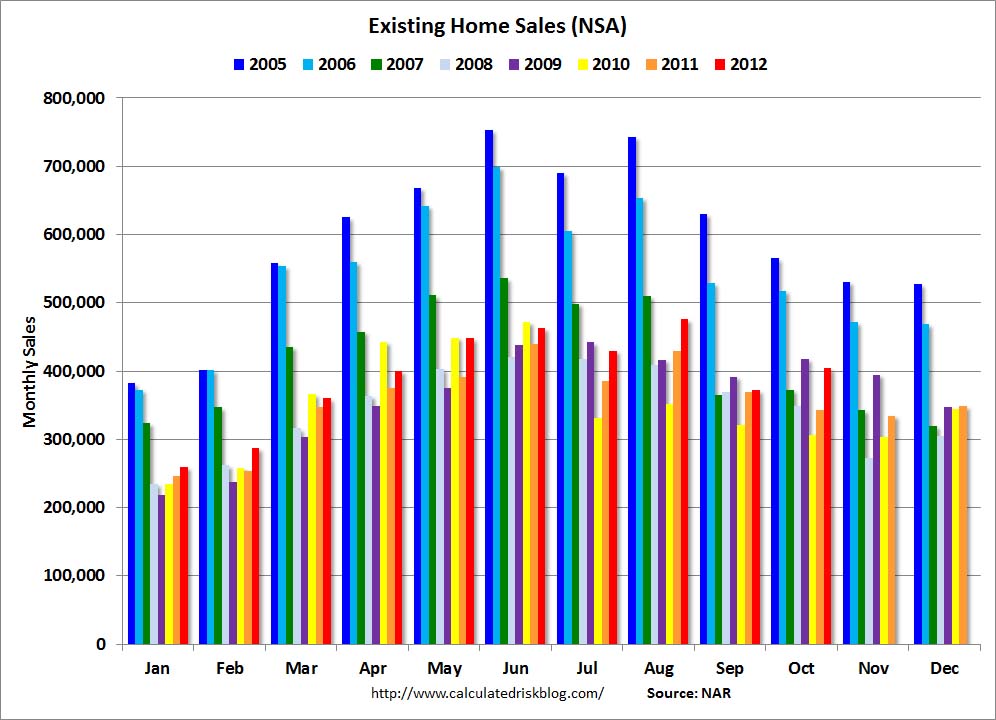
click for giant graphic

Source: Calculated Risk
The NAR reported that Existing Home Sales rose 2.1% in October, better than 2011 and 2010, but still below the tax credit driven activity in 2009.
The key difference between 2012 and the prior two years has been how far the Fed has driven rates — about 3.375% for a 30 year fixed mortgage.
We continue to see Distressed homes (foreclosures and short sales) below where they were prior to the voluntary foreclosure abatements — they are about 24% of October sales versus high 30% in years gone by. The NAR estimates these foreclosures sold for an average of 20% less than “market value,” but I have no idea what their basis of claiming that is. How does the NAR “know” a distressed house goes for 20% off market value — what actually is market value, and how do they assess that measure? I will see if I can dig up their methodology.
The other details of the housing data were fairly decent: They were 10.9% above October 2011. The national median existing-home price was $178,600 in October, up 11.1% year-over-year, the eighth consecutive monthly year-over-year increases. Inventory also fell to 2.14 million existing homes available for sale, a 5.4-month supply.
The initial monthly data continues to be a bit optimistic — September EHS were revised downwards.
All-cash sales were 29% of all transactions — the combination of private equity investors, overseas buyers and high end homes being the drivers of this stat.
Update 12:59 pm 11/19/12: I see that Bill at Calculated Risk notes that NAR Distressed Sale data are “questionable,” and are the results unscientific survey of Realtors. This is a better methodology)
Sources:
Existing-Home Sales Rise in October with Ongoing Price and Equity Gains
NAR November 19, 2012
http://bit.ly/UP4G64


What's been said:
Discussions found on the web: