Yesterday evenings reads led with a link to Mark Hulbert’s How to know when it’s time to leave the party. Hulbert created a backtest that compared being “fully invested in the Dow whenever it was above its 200-day moving average, and otherwise completely out of the market.”
That above or below signal in theory keeps you out of trouble. I prefer to use a broader index than the Dow — which is too small, too large cap — such as the S&P500 or the Wilshire Total market.
The problem with using the 200 day is it generates a new data point daily. This potentially creates a new buy or sell signal every single day the market is open. That is potentially rather “whippy” — subject to many false signals of breakouts and breakdowns,
One simple solution is to use the 10 month moving average instead. (10 months is roughly 210 trading days). Since it only generates a new data point once a month, it removes a lot of the head fakes and false signals.
I mentioned this to Mebane Faber, whose done a lot of number crunching on this issue. In an email, Meb notes the following:
1. It doesn’t matter what precise indicator you use (i.e., 50 day SMA, 10 month SMA, 200 day EMA etc), they generally perform similarly over time and across markets. Of course, in the short term there will be very large variation (example Oct 1987), but on average they are similar.
2. You have to include dividends and interest paid on cash. Most trend models don’t trade that much vs. a normal rebalance, and transaction costs are low now (although substantial the longer you go back).
3. The point about daily vs. monthly signals is valid, in that daily will get whip sawed around more and also incur more transaction costs.
4. The main takeaway, and missed often, is that trend indicators in general are not return enhancing (although they often are in the more volatile asset classes like Nasdaq or REITs). They are mainly risk reducing for volatility and drawdown. This results in higher Sharpe ratios and a less volatile portfolio.
5. If you want return enhancing, a relative strength or momentum approach works great. But the magic occurs once you start combining lots of assets with lowered vol and drawdowns….results in a great portfolio.
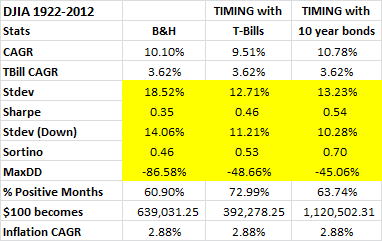
Here is Meb’s data for the DJIA back to 1922. It’s a simple 10 month SMA on the total return index, and places the cash in either Tbills or 10 Year Bonds.
Note that it doesn’t do much for returns — I argue it is because the entries and exits are symmetrical (my thesis is they shouldn’t be). Rather, using the 10 month manages works to drastically reduce volatility (by about 33%) and cuts down drawdowns (by about 50%).
Source:
How to know when it’s time to leave the party
Mark Hulbert
MarketWatch, Feb. 19, 2013
http://www.marketwatch.com/story/how-to-know-when-its-time-to-leave-the-party-2013-02-19
See Also:
Moving Averages: Month-End Update
Doug Short
Advisor Perspectives February 1, 2013
http://www.advisorperspectives.com/dshort/updates/Monthly-Moving-Averages.php


What's been said:
Discussions found on the web: