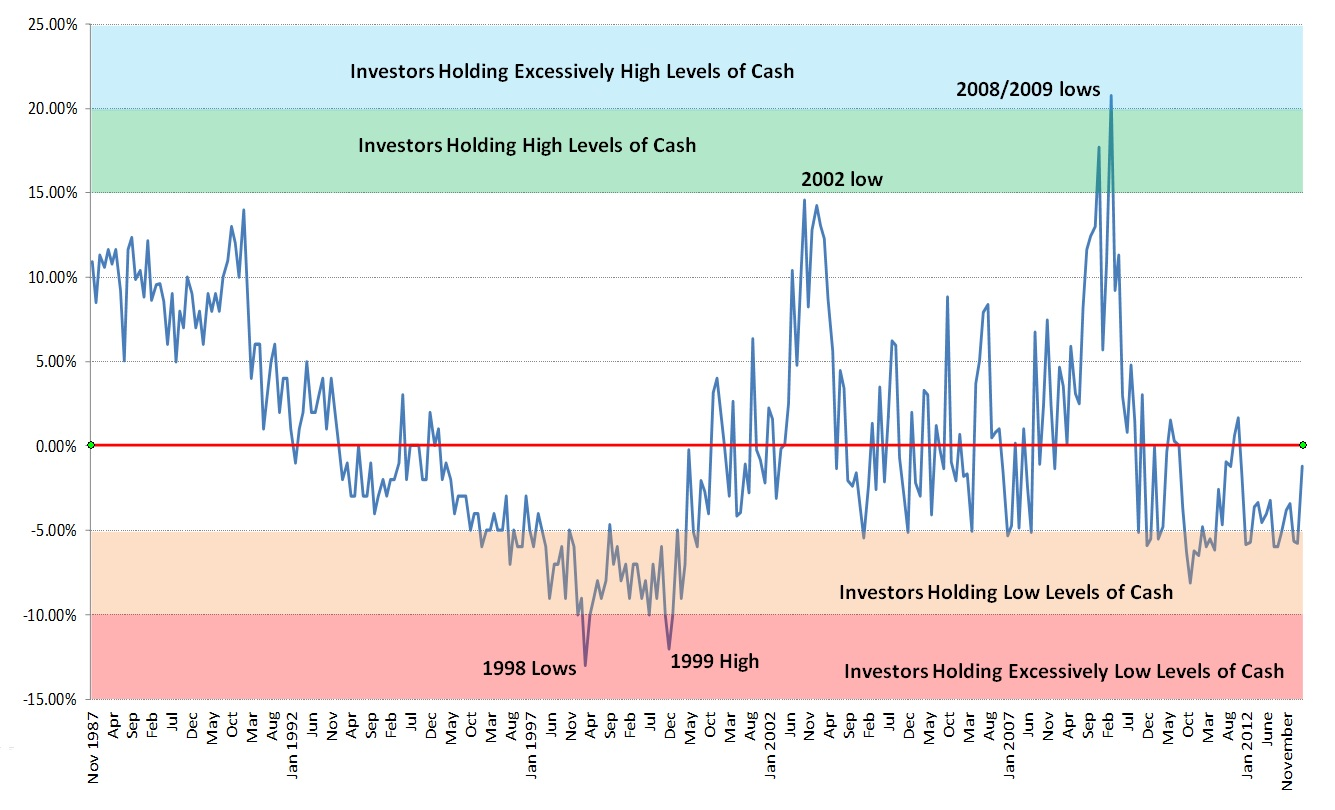
click for ginormous chart

Source: AAII, Fusion Analytics
Today, lets look at another interesting data point from AAII: Cash allocations reached a 16-month high in March. Individual investors pulled money from both equities and bonds last month.
We have shown the flip side of this chart in the past — equity allocation — which is similarly moderate.
Equity allocations fell 3.0 percentage points to 59.5% in March. Surprisingly, the past 15 months have not seen much variation in equity allocations stuck in a range from 58.8% (June 2012) to 62.5% (February 2013). The historical average is 60%.
March AAII Asset Allocation Survey results:
• Stocks Total: 59.5%, down 3.0 percentage points
• Bonds Total: 17.7%, down 1.5 percentage points
• Cash: 22.8%, up 4.6 percentage points
Historical Averages:
• Stocks/Stock Funds: 60%
• Bonds/Bond Funds: 16%
• Cash: 24%


What's been said:
Discussions found on the web: