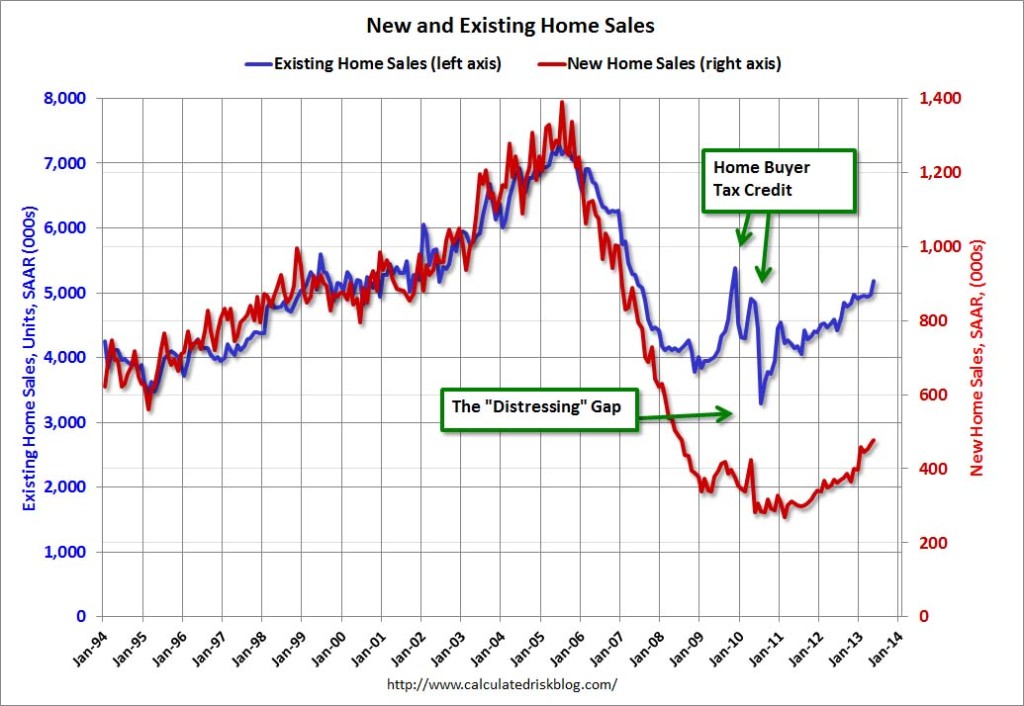
The Distressing Gap
click for ginormous graphic

Chart via Calculated Risk
Yesterday, I posted a chart showing how weak New Home Sales were relative to existing home sales.
Mark Hanson wanted to flash some color on that — here is his 3 part explanation as to why the Builders are having such a difficult time:
1) No Flippers: The reason that New Home Sales is still down 60% from the peak while existing is only down 25% is due to the new-era private and institutional “buy to flip/rent” investor. They don’t call Hovnanian for buy to flip or rent opps.
This shows how powerful a force new-era investors — driven by the QE inspired quest for yield — really ‘were’. I say ‘were’ because at 2.5% on the 10s a house yielding 3% doesn’t look as good as it did with 10s at 1.5%. If institutional investors leave this housing market Existing Sales and prices will look a lot like they did after the 2010 Tax Credit sunset and the 18 month stimulus “hangover” ensued.
And with Foreclosures/short sales down up to 70% in the most popular legacy “Bubble Years”/new-era “recovery” regions I think it’s safe to say that investors will turn into net sellers soon, if they not already are.
2) EHS Double Count Flipping: Moreover, it is very important to note that “flipping” is at a high meaning Existing Home Sales are being counted TWICE in a year in many cases…the first time when the bank REO or short sale is done. And the second 3 to 12 months later after it’s been rehabbed/remodeled. This could be boosting Existing Home Sales by 3-5% per month. When you “flip-adjust” the past year of Existing Sales they are not so spectacular either…pretty flat in the context of “post-crash”.
3) Overcounting Distressed Market Values: Lastly, counter intuitively the distressed market — now at 6 YEAR LOWS in terms of volume (due to OVER 6 MILLION “new-vintage, higher-leverage, worse-than-Subprime loans AKA: loan mods) — was responsible for an outside percentage of the Existing house price “appreciation” we are seeing. That’s because when I buy a dump for $150k, put $50k into it (cost basis $200k) and resell for $230k, the popular price indices — included Case-Shiller if owned over 6 months by the investor — pick it up as $80k “appreciation” when in fact it’s only $30k…and a suspect $30k at that.
Bottom line, the distressed market was “the” housing market for years. It’s what everybody wanted. It has been absolutely responsible for the short squeeze in housing over the past 18 months and a large percent of house price gains (of course, the 30-year fixed mortgage rate being forced down in QE3 from 5% to 3.5% was worth 15% to house prices as well). And the artificial lack of distressed due to loan mods, new anti-foreclosure laws, and perma foreclosure timeline extending — coupled with rates back to pre-QE3 levels — will be responsible for “Hangover 2” that follows.
There you have it, from Mark Hanson.


What's been said:
Discussions found on the web: