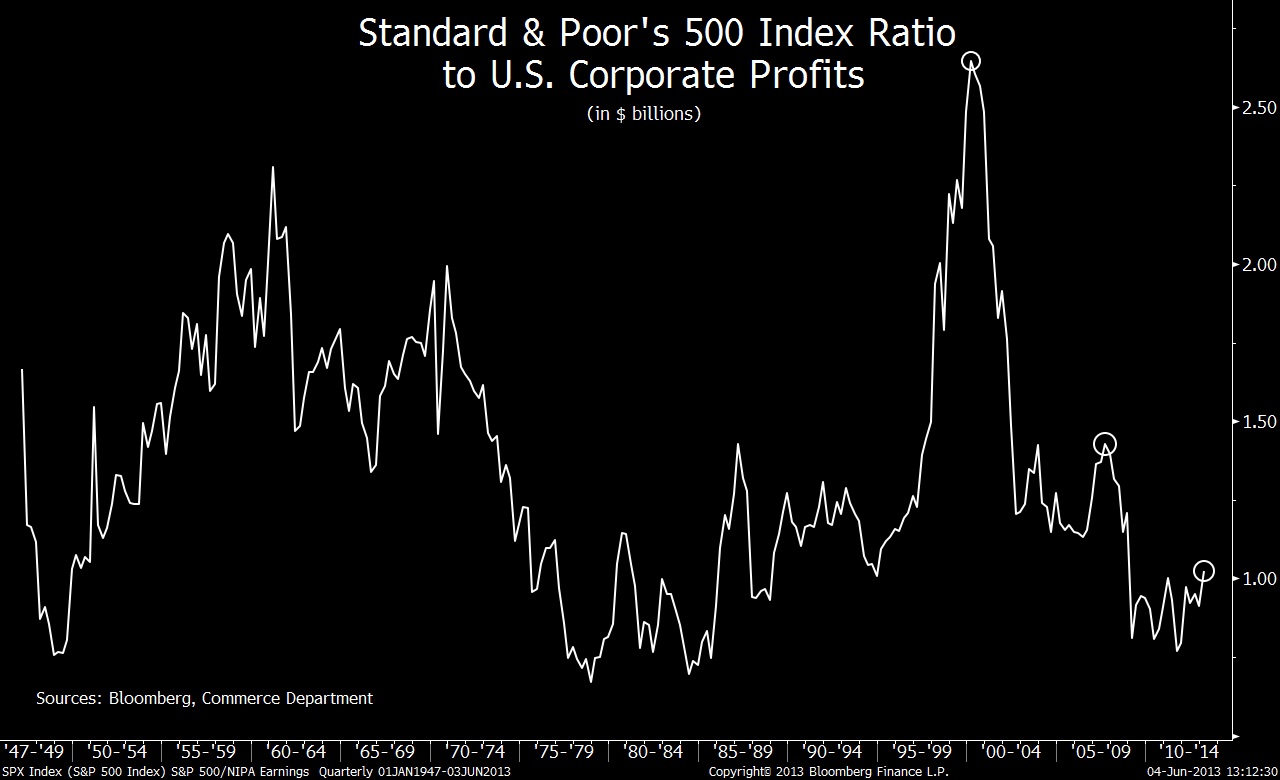
I have to admit: I have never seen this ratio before. Standard & Poor’s 500 Index to profits at all U.S. companies. Its a price to earnings ratio of the main US stock market against ALL US earnings.
According to this little used, odd ratio, Stocks are much cheaper after four years of gains than they were in the two previous bull markets. This look at corporate earnings is based on work by Neil Dutta, head of U.S. economics at Renaissance Macro Research LLC.
In the above chart. we see a ratio shows, the ratio of the Standard & Poor’s 500 Index to profits at all U.S. companies, as compiled quarterly by the Commerce Department and expressed in billions of dollars. For the first quarter, the reading was 1.02. Although the latest ratio was the highest since 2008, it was far from peaks of 1.43 in the third quarter of 2007 or 2.65 in the first quarter of 2000, as the chart shows. Both readings were posted near the end of multiyear gains in share prices.
Dutta said “The stock market’s performance has been well supported.”
I am not quite so sanguine.
The good news is 2013 Q1 operating earnings equaled $25.76 on a per-share basis, based on results reported as of last week. The bad news? Well, look at your screens the past few weeks . . .
Source:
David Wilson and Chris Nagi
Bloomberg, June, 4, 2013


What's been said:
Discussions found on the web: