Are investors being too complacent?
That is the question that an be looked at in several different ways. Some folks rely on anecdotal evidence. Others use the VIX or the Put Call ratio.
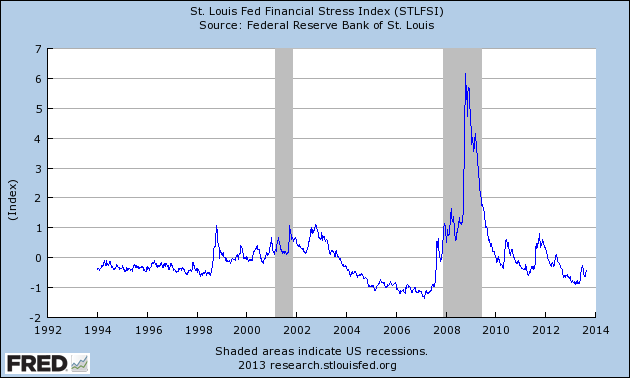
The St. Louis Fed uses their own metric which they call the “Financial Stress Index” (STLFSI). It combines 18 different weekly data points. In this morning’s WSJ, Spencer Jakab discusses what this means for equities: A Stress Gauge Suggests Potential Upside for Stocks. He notes that latest reading (August 30) was “well below the average since December 1993, that reading is less-stressed than four-fifths of all readings over that time.”
Given all of the negative headlines on Syria, and the Taper, plus the recent spike in yields, one would have expected markets to be quite skittish.
The key question is how skittish — how volatile, and how extreme are the reactions. Therein lay the tricky aspect of using sentiment: It only really indicates a potential market reversal when it hits an extreme level.
Jakab notes:
“The lowest readings in history came in the early weeks of 2007 when stocks were booming and the first signs of the subprime-mortgage crisis were about to appear. The highest 12 readings all came in late 2008 following the collapse of Lehman Brothers.”
As the chart below shows, we are not currently anywhere near the levels of mass complacency. This suggests that markets are still climbing “the wall of worry” — and could still have further to run. YMMV
St. Louis Fed Financial Stress Index (STLFSI)

Source: St. Louis Fed
Source:
A Stress Gauge Suggests Potential Upside for Stocks
Spencer Jakab
WSJ, September 8, 2013
http://online.wsj.com/article/SB10001424127887323893004579059423599890740.html


What's been said:
Discussions found on the web: