A 90% up day is bullish & the stats support a year-end rally
click for giant table

Source Merrill Lynch BA
On Thursday. we had a huge up day, with US markets gaining ~2%. Some folks credited the possibility of a debt ceiling deal, while others called it a low volume short covering rally. Regardless, it was substantial, and should not be ignored.
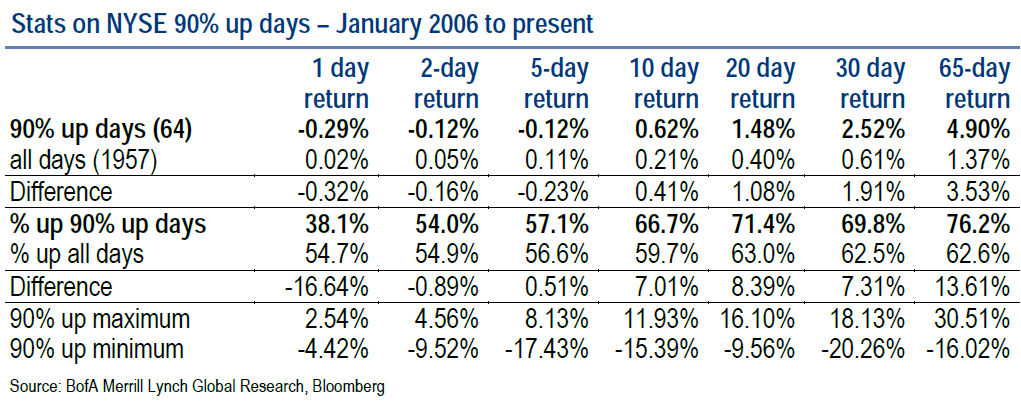
As the table above showed, these 90/90% up days– when 90% of stocks on the NYSE are up and 90% of the shares traded are to the upside — the tendency is towards higher future returns in the ensuing weeks and months.
As you can see in the table above, 20, 30 and even 65 days after a 90/90 day, markets are higher at least 70% of the time. Under normal circumstances, that range would be low 60% range. In other words, the odds of gains improves some 10% over normal following a 90/90 day in our time period (20, 30 or 65 days from 2007-present) .
Here’s Merrill’s Stephen Suttmeier:
“That big buying the US equity market opened strong with a 90% up day (at least 90% of stocks on the NYSE up on at least 90% up volume) and the equity market maintained this 90% up day into the close.
This is bullish and was the first 90% up day since the pair of 90% up days from 12/31/12 and 1/2/13. We have data on 90% days going back to January 2006. Since then 90% up days have occurred only 3.3% of the time, but after a 90% up day, the S&P 500 has well above average 10, 20, 30, and 65 day returns and this supports the case for a year-end rally. For example, the 65-day S&P 500 return after a 90% up day is 4.9% vs. an average 65-day return of 1.4%. Interestingly, the 1, 2, and 5-day returns for a 90% up day are below average and negative. This suggests buying into a short-term dip after a 90% up day.”
That 14% edge over 65 days isn’t a sure thing, but it is quite statistically significant . . .
Source:
A 90% up day is bullish & the stats support a year-end rally
Merrill Lynch Bank America, October 11 2013
Stephen Suttmeier


What's been said:
Discussions found on the web: