@TBPInvictus here:
David Rosenberg made a point in his note Monday that I don’t think went quite far enough, or at least needs a bit more color:
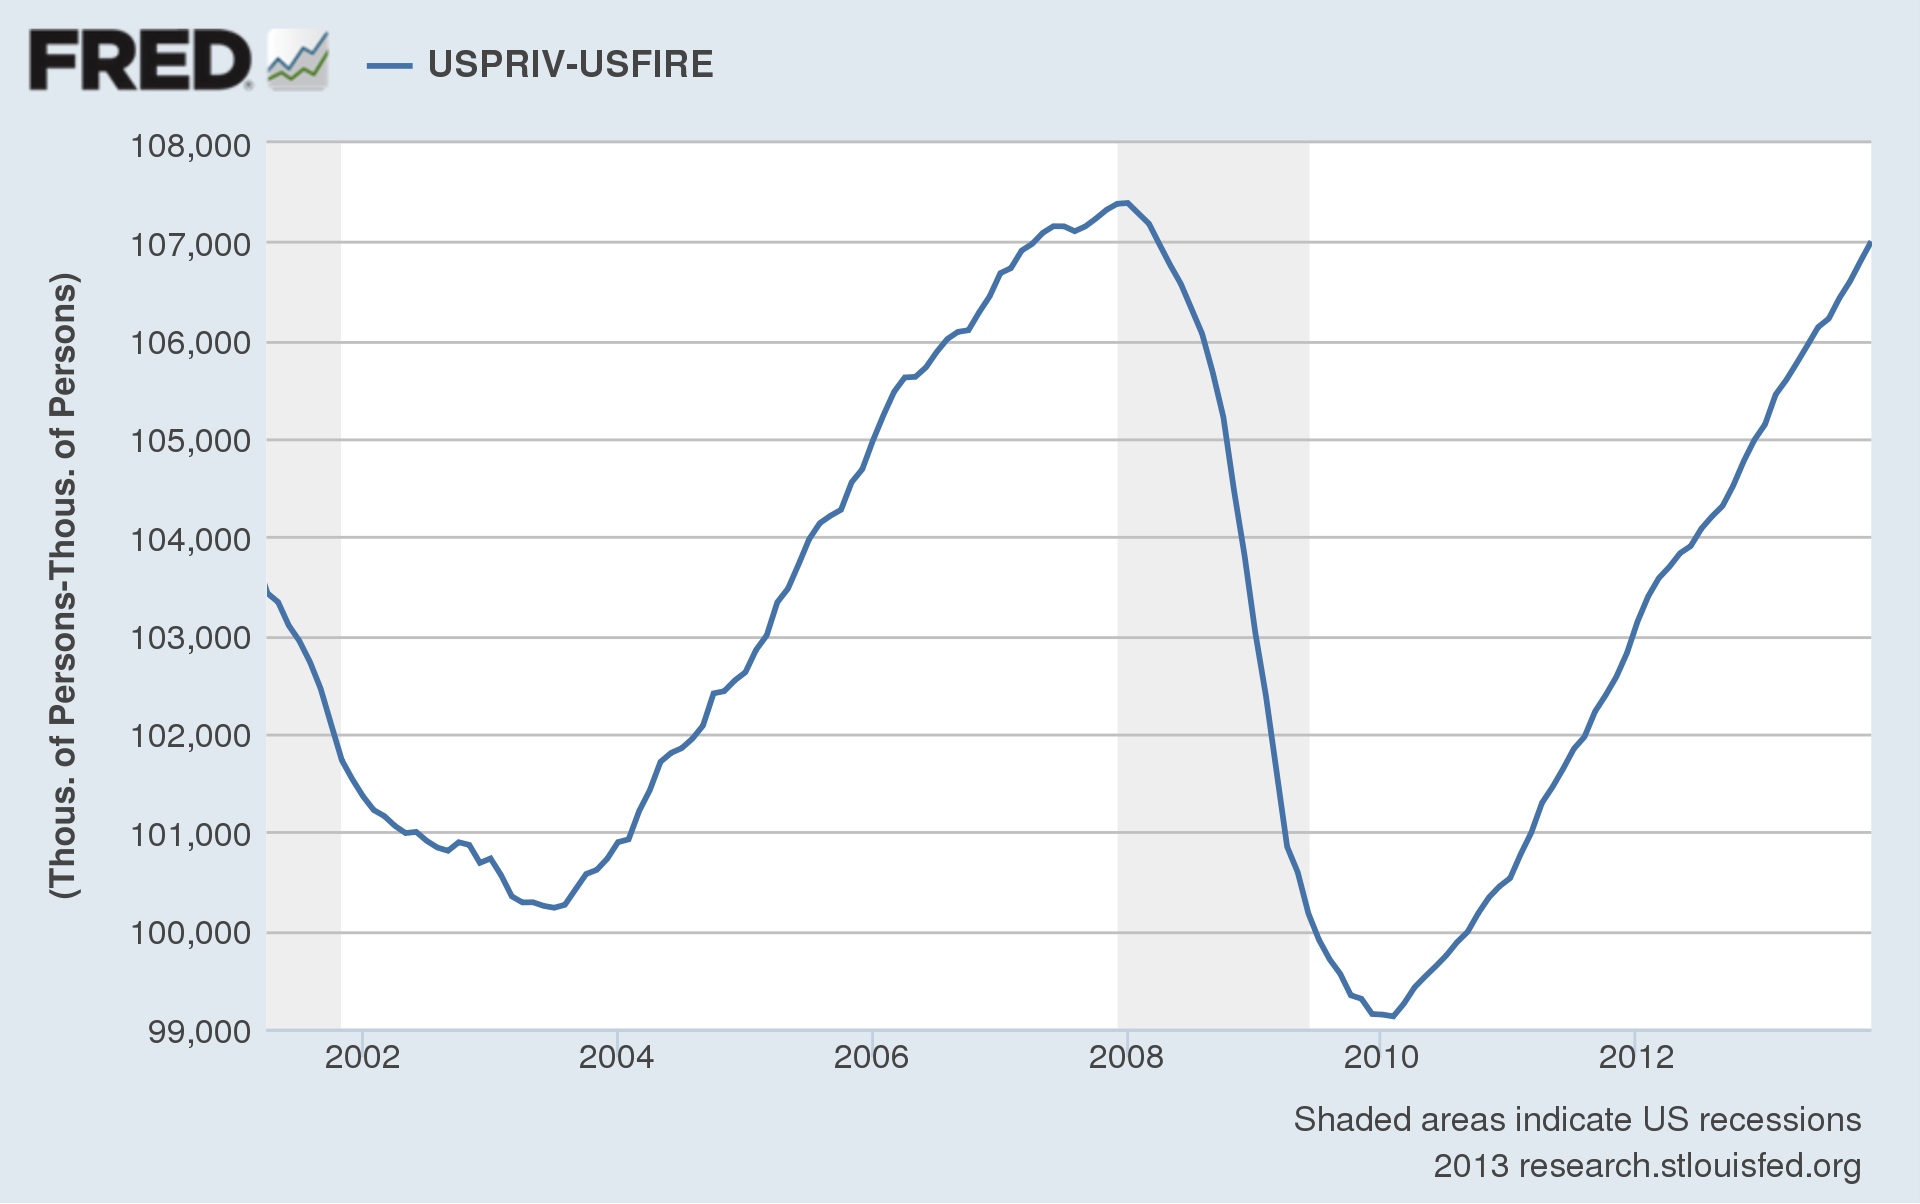
Rosie then showed the chart below (the Haver Analytics version of it, anyway), which he dubbed “Employment Less Financials in Private Sector.” In St. Louis Fred-speak, that would be USPRIV – USFIRE:
We can probably agree with Dave that many jobs of the last cycle, particularly in finance, were indeed due to “obvious unsustainable credit bubble.”
Now, all that said, here are some numbers out of the above chart:
Trough was July 2003 at 100,230.
Subsequent peak was Jan 2008 at 107,393.
That’s an annualized growth rate, by my calculations, of 1.52%.Subsequent trough was February 2010 at 99,126
We’re at the (ongoing) peak at 107,003
That’s an annualized growth rate of 2.02%
Point here being that we are currently running at a 2.02% more naturally, if you will, than the 1.52% rate which itself was inflated by artificial, credit-bubble-induced hiring, mostly in the finance sector. And we are indeed within striking distance of eclipsing the January 2008 high within the next couple of months.


What's been said:
Discussions found on the web: