
Major Trend Analysis
The 2000-2003 Bear Market
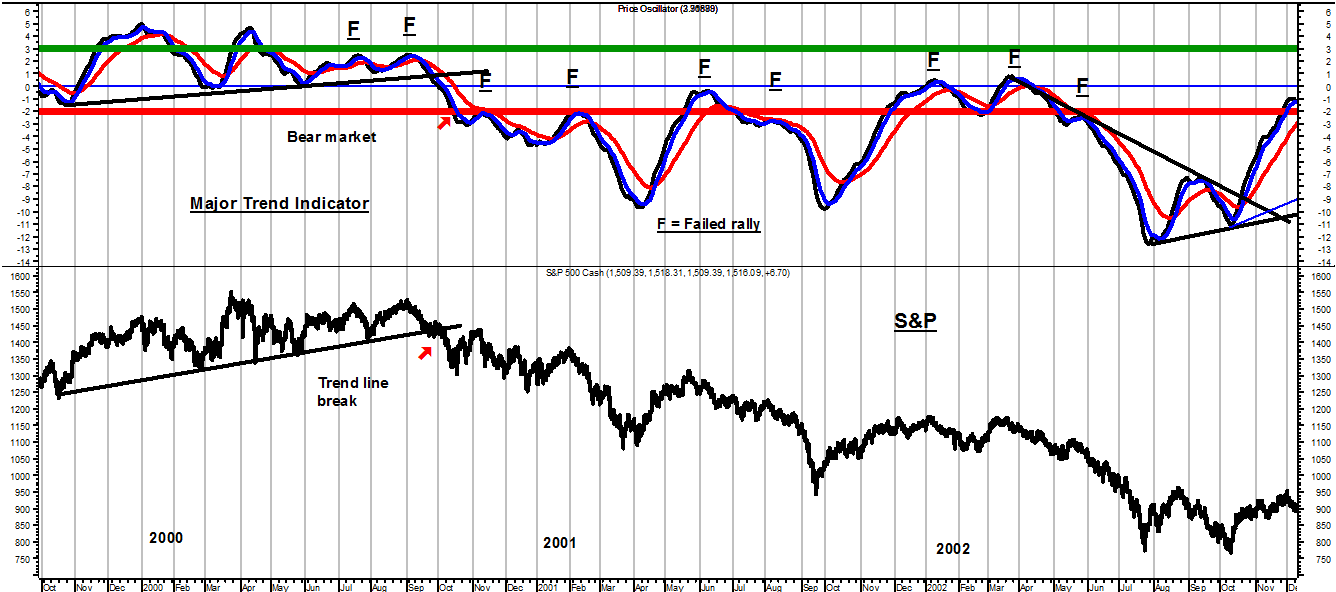
The Major Trend Indicator (MTI-black line) is helpful in identifying when the market is vulnerable to an intermediate correction within a bull market, and the onset of a bear market. Ongoing bull markets are confirmed when the MTI climbs above the green line. When a rally fails to lift the MTI above the green line, the market is vulnerable to an intermediate correction. When the MTI falls below the red line, after failing to rally above the green line, a bear market is confirmed. The 2002-2003 bear market was signaled on October 6 and confirmed on October 12, 2000. The S&P also broke below a rising trend line signifying a breakdown and chart support on October 6. The F signifies a failed bear market rally as measured by the MTI, since the rally failed to lift the MTI above the green line.
The 2007-2009 Bear Market
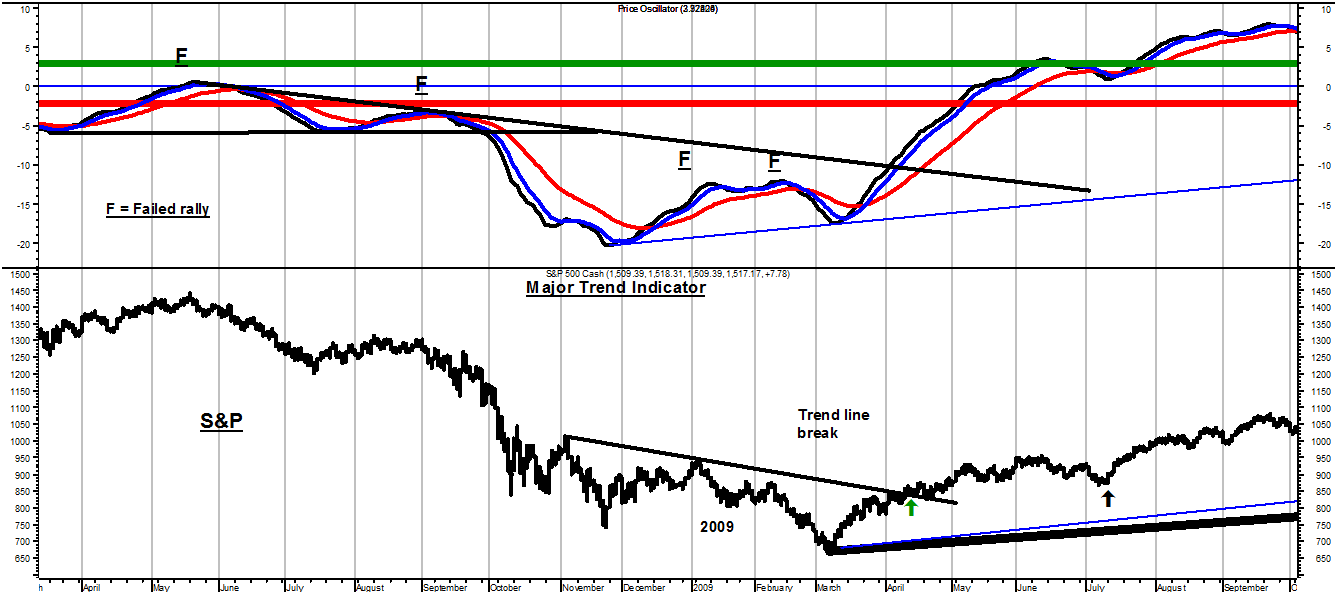
When the S&P rallied to a new high in October 2007, the Major Trend Indicator failed to move above the green line. This indicated that the market was susceptible to an intermediate decline. The S&P broke below chart support on November 7, 2007, trend line support on January 4, 2008, and confirmed a bear market on January 10, 2008, when the MTI fell below the red line.
Bear Market Rallies
Bear market rallies are signaled when the MTI crosses above the red moving average, with sell signals indicated when the MTI rolls over and declines by a specific amount. The market experienced a failed rally in May and August 2008. The August rally didn’t even rise above the red line, suggesting the market was very weak. The numerous bear market rallies during the 2000-2003 bear market were more protracted and offered better profit opportunities.

Bear Market Bottoms
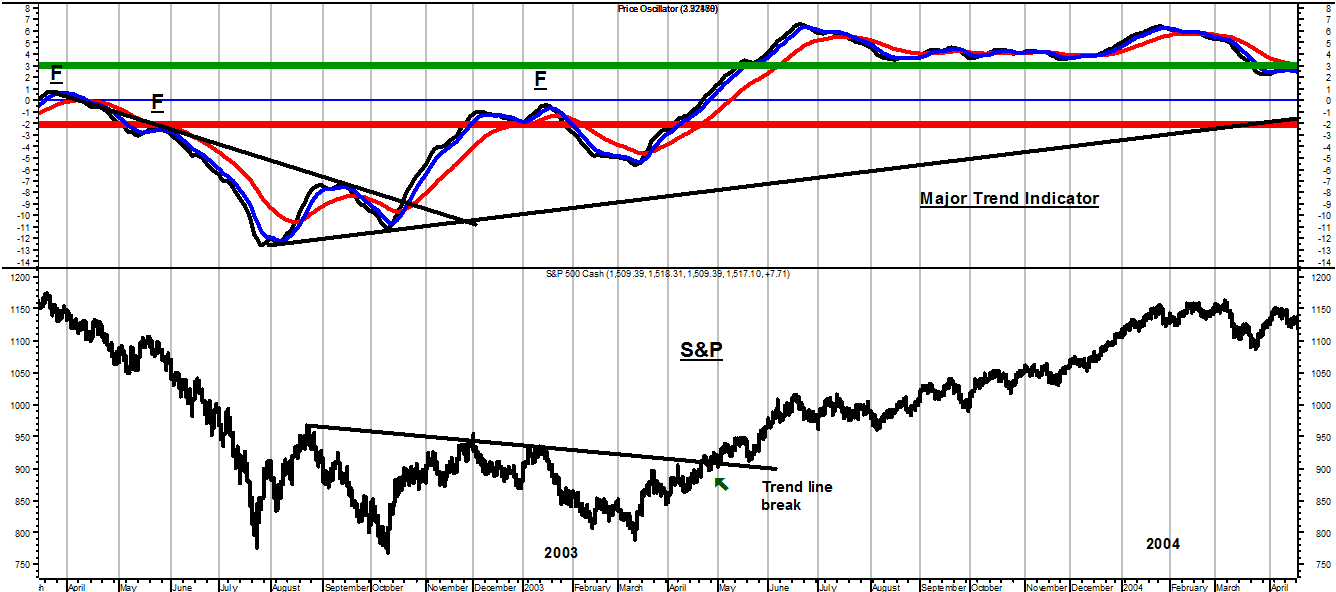
The formation of a bottom and end to a bear market is a process. First, the Major Trend Indicator reaches an oversold level, as it did in July 2002 and November 2008. After another failed rally and subsequent market decline, the MTI bottoms above the prior oversold level, as it did in October 2002 and March 2009. In 2003, the S&P made a higher price low in March 2003 and the MTI was significantly less oversold. The initial entry signal occurs when the MTI crosses above the red moving average,(3- 18-03, 3-17-09) since it is not possible to know when a bear market rally will blossom into a new bull market. The new bull market was confirmed when the MTI pushed above the green line weeks later in April, 2003 and May, 2009.
Intermediate Declines within Bull Markets
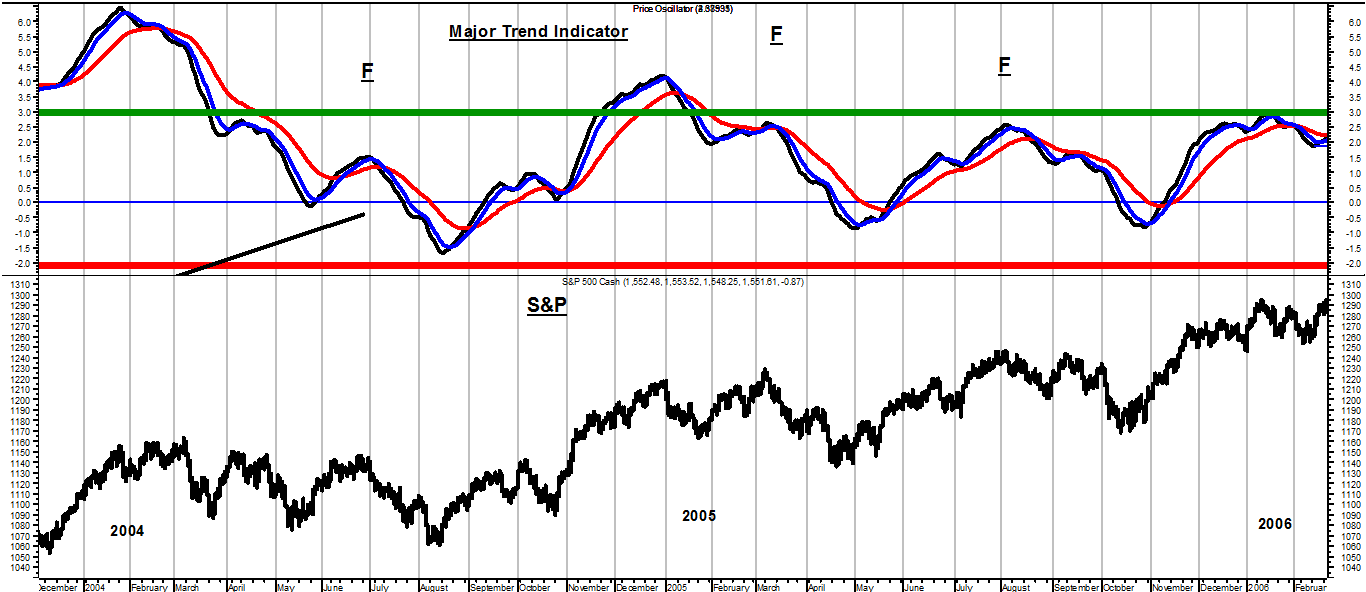
After the new bull market was confirmed by the Major Trend Indicator in April 2003, there were intermediate declines in 2004, 2005, and 2006 that were presaged by rallies that failed to push the MTI above the green line. These Failed rallies indicated the market was vulnerable. However, the overall economic environment remained healthy, with most economic reports being supportive of further growth. As a result, selling pressure remained muted and none of the declines in 2004, 2005, and 2006 were severe enough to drop the MTI below the red line and signaling a bear market. The flow of negative news plays an important role in determining the depth of intermediate declines. Most mutual fund managers will typically remain 90% to 96% invested all the time, since their investment objective is to find companies that meet certain fundamental criteria, and their investment time horizon is often three to five years. If their economic expectations are positive, they will not be sellers until the economic fundamentals turn sour. The intermediate declines after these failed rallies were 7%-9%.
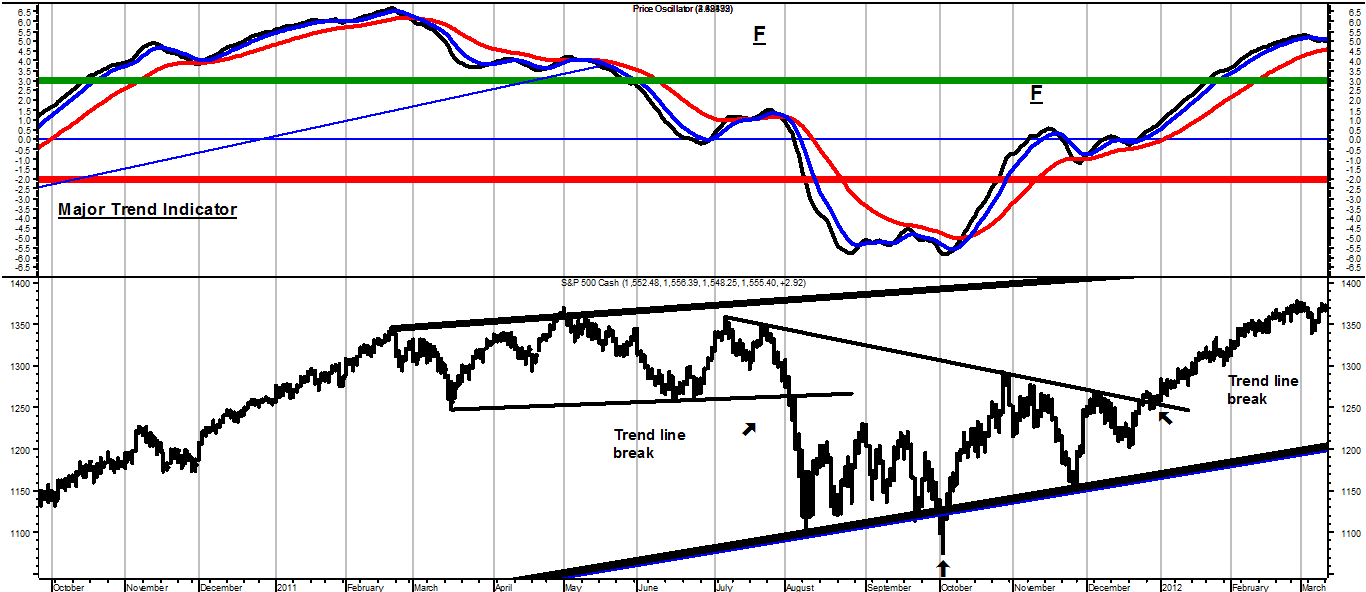
In 2011, the Major Trend Indicator failed to reach the green line in July, as the S&P was retesting the high it reached in May. The failed rally in July indicated the market was vulnerable to negative news. On August 2, the S&P 500 broke below trend line support near 1,250 on the S&P, and by August 8 the MTI fell into bear market territory. In early August Congress argued about raising the debt ceiling and Standard and Poors lowered its rating on U.S. Treasury debt from AAA to AA. This provided institutional investors reasons to sell. The S&P broke out above the trend line in December, and by January the market was back into a bull market based on the MTI.
Jim Welsh
Portfolio Manager
![]()

What's been said:
Discussions found on the web: