
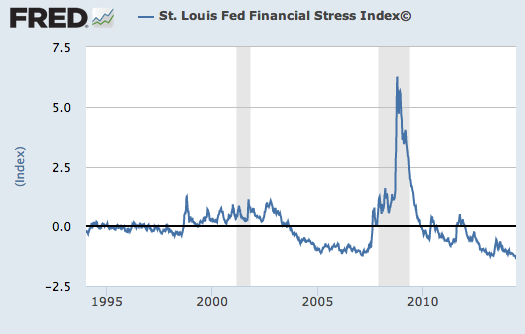
For the week ending June 6, the St. Louis Fed Financial Stress Index (STLFSI) rose to -1.256 from -1.289. The latter is currently the lowest level on record for the index, which goes back to December 1993. The recent increase in the index was the first in the past five weeks, and the index has been below zero for more than two years (127 weeks). But what does all of this mean?
In the aftermath of the financial crisis, arguments arose over how to monitor financial market developments, with measurement of “stress” in the market being a likely requirement of any regulator engaging in such monitoring. However, there are many ways to monitor financial stress. For example:
- An interest rate spread, such as the difference between yields on a “risky” asset (such as corporate bonds) and a “risk-free” asset (such as U.S. Treasuries), may be used to measure default risk.
- Whether financial institutions are able to secure funding to finance short-term liabilities may indicate liquidity risk.
In an attempt to avoid focusing on a single indicator at the expense of others, economists and analysts created composite indexes of several of these indicators. In early 2010, the St. Louis Fed created the STLFSI, which uses 18 weekly data series to measure financial stress in the market. Weekly series are used to have a more “real-time” index to measure rapid changes in the market. However, the tradeoff of having a higher-frequency index is greater volatility and potentially more noise.
The STLFSI is constructed from seven interest rate series, six yield spreads and five other indicators.1 Each of these variables captures some aspect of financial stress. Accordingly, as the level of financial stress in the economy changes, the data series are likely to move together.
How should the index be interpreted? The average value of the index, which begins in late 1993, is designed to be zero. Thus, zero is viewed as representing normal financial market conditions. Values below zero suggest below-average financial market stress, while values above zero suggest above-average financial market stress.
Each week, the St. Louis Fed provides a news release based on the STLFSI. The news release includes details for the following:
- The latest STLFSI reading
- The contribution of each indicator to the weekly change in the STLFSI
- The contribution of each indicator to the change in the index from one year ago
Notes and References
1 See the STLFSI Key for a list of data series used in the index. For more details on the construction of the STLFSI, see the appendix to the January 2010 issue of the St. Louis Fed’s National Economic Trends.
Source: Federal Reserve of St. Louis
