Your Weekend Reading on the CAPE
A model used to value stocks developed by Yale economist Robert Shiller has some distinct pluses and minuses. Bloomberg, August 22, 2014
In our discussion of Mr. Market, we made passing reference yesterday to CAPE, Yale professor Robert Shiller’s 10-year cyclically adjusted price-earnings measure. This led to quite a conversation via a series of e-mails and Twitter posts from an assortment of analysts and asset managers. I received research from or by Cliff Asness, Michael Kitces, Mebane Faber, Jeremy Siegel, Salil Mehta, Stephen E. Wilcox, Doug Short, Wade Slome, Erik Kobayashi-Solomon, Ben Carlson and Jesse Livermore. If you want a crash course in CAPE, spend the weekend digesting what they have to say.
Today, I want to focus on the pros and cons of CAPE, giving airtime to all sides of the argument. My main interest in CAPE has more to do with behavioral issues such as confirmation bias by those who cherry pick CAPE as their preferred valuation metric when it suits their market position.
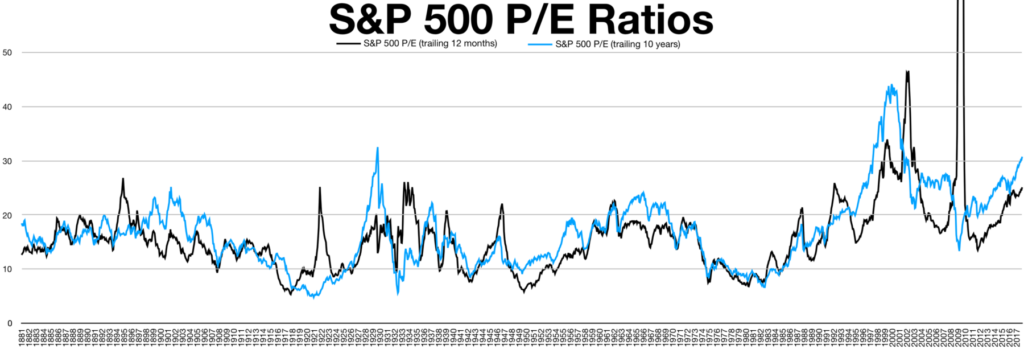
Let’s start with a few words about valuation and timing. Cyclically adjusted price to earnings uses the prior 10 years of trailing per-share earnings rather than just the previous four quarters. This reduces the short-term volatility. In theory, it should include at least one full business cycle, and possibly more. Shiller has said that he was trying to develop a valuation metric that would tell an investor whether equities were likely to outperform their median returns during the next decade.
Shiller’s CAPE does this well. As Faber of Cambria Investment Management observed, when CAPE measures are less than 10, future 10-year returns are outstanding. Over the long run, returns fall the higher CAPE rises. However, in the short run, it is anyone’s guess. As Kitces has noted, CAPE is terrible as a market-timing tool, but it does add value for long-term retirement planning.
Why then all the carping over CAPE? Let’s take a quick survey of what CAPE does well, it’s weaknesses and how it should be used.
Consider what CAPE does well:
1) Expected Returns: CAPE is good at providing expected 10-year equity returns. Stated simply, when CAPE is elevated, expected returns tend to fall; when it is depressed, expected returns rise. Not many other indicators can make this claim.
2) Market Peaks: When readings of CAPE are at very high (typically top quintile) it can signal a market top. In 1929 and 2000 CAPE levels were higher than 30.
3) Market Bottoms: When CAPE measures are at extreme lows, it generates an excellent long-term entry point into equities. Investors should consider CAPE readings in the lowest quintile as very inexpensive markets.
The measure of CAPE is simple, clean, easy to understand, and has a century-long track record. Thanks to Shiller, it was well-conceived and objective. These qualities suggest a usefulness and legitimacy that not many other metrics can claim to match.
There are numerous criticisms of CAPE:
1) Financial-Crisis-Distorted Earnings: Earnings plunged during the 2007-09 financial crisis, and in several quarters were zero. Losses by financial and related companies amounted to $1 trillion. That boosted CAPE by several points.
2) Changes in Accounting: This is Siegel’s main line of criticism. He also points out that while “S&P reported earnings dropped precipitously due to a few companies with huge write-offs, NIPA earnings were more stable.” If we were to substitute national income and products account earnings for the Standard & Poor’s 500 Index, we end up with a fairly attractive valuation.
3) Low Interest Rates: With less competition from fixed income assets, stock markets end up with a higher P/E ratio than they otherwise would. Morningstar’s Michael Rawson observed, “Lower interest rates, in theory, should result in higher prices, and that is exactly what we find in the data.” The lower yields seem to go, the higher both equities and CAPE seem to rise.
4) Track record: Perhaps the biggest criticism is that since 1990, CAPE has spent 98 percent of the time above its historical average. The metric’s failure to mean-revert over the last 23 years raises questions about its long-term utility.
As my colleague Josh Brown has noted, “Adherents of CAPE were telling anyone who would listen that US equities were as much as 40% overvalued as of July 2009, some 8000 thousand Dow Jones points ago.” That’s a fairly brutal critique of even a long-term indicator.
There are quite a other CAPE criticisms. The ERISA laws, first adopted in 1974, created an entire new class of stockholders via 401(k)s and IRAs.
The composition of markets is different today. Indexes are now more heavily weighted with technology and information-services companies versus industrials. Tech tends to be more profitable, and garner higher P/Es than other more capital-intensive industries. The way stock options are expensed has changed as well, and tech firms tend to use them as a form of compensation more than other companies.
The bottom line seems to be that CAPE is useful as a measure of valuation. It isn’t especially good for market timing, though it is better at bottoms than tops. Changes in society, technology, investing and accounting might have shifted CAPE higher somewhat, but that is difficult to assess. The financial crisis also affected the ratio by a few points. Lastly, low interest rates may be boosting CAPE beyond its average.
Here are sources and research on Shiller’s CAPE. Enjoy your weekend homework.


