
The Seeds of U.S. Inflation Have Sprouted and Could Be in Full Flower in 2016
Paul Kasriel
September 8, 2014
I subscribe to the tenet espoused by the late Professor Milton Friedman that inflation is a monetary phenomenon. When I speak of inflation, I include not only the behavior of prices of goods and services but also the behavior of the prices of assets. I believe that a sustained acceleration in the growth of credit created figuratively out of thin air, i.e., the sum of credit created by depository institutions (e.g., commercial banks) in a fractional reserve monetary regime and credit created by the central bank, ultimately will result in the acceleration of prices of goods/ services and/or assets. Chart 1 shows that a sustained acceleration in thin-air credit has commenced. As of July 2014, the latest complete monthly data available, the year-over-year change in the sum of commercial bank adjusted loans, leases, securities (let’s call this bank credit) and commercial bank cash assets (let’s call this Fed credit, which will be explained below) was 9.7%, the fastest growth in this measure since December 2005. Starting in October 2013, year-over-year growth in this thin-air credit measure has consistently been above 8.0% vs. a 41-year median growth rate of 6.9%. Commercial bank cash assets largely are reserve balances held at the Federal Reserve as well as currency held as bank vault cash, both of which are Federal Reserve liabilities or credit created by the Fed figuratively out of thin air. (Commercial bank assets are adjusted for mergers and acquisitions with nonbank depository institutions such as S&Ls).
Chart 1
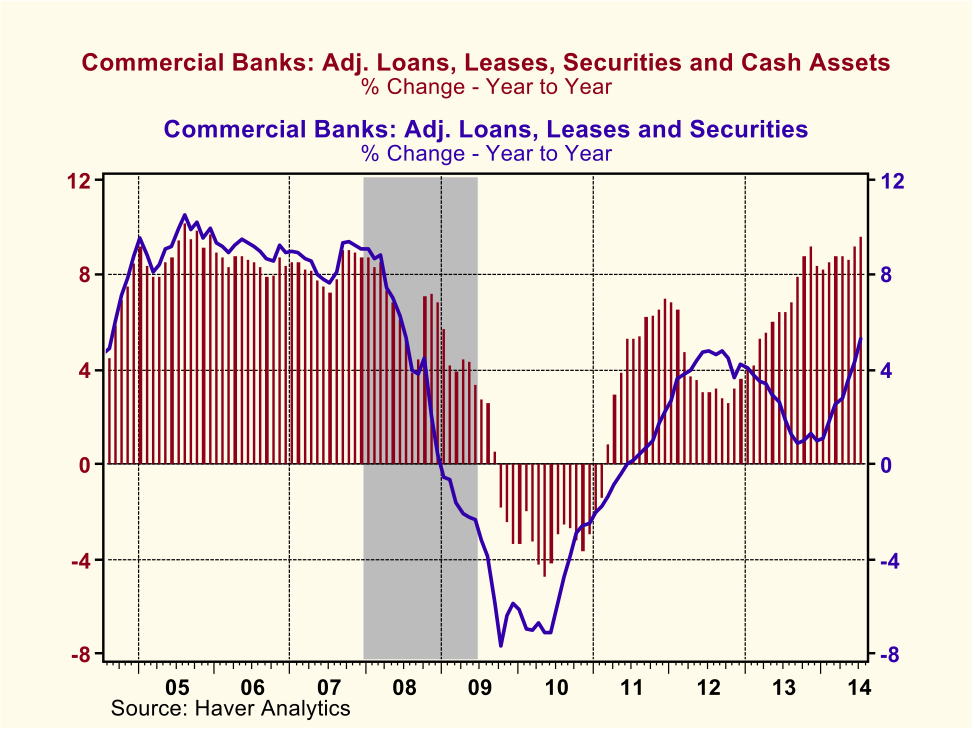
Also shown in Chart 1 are monthly year-over-year percent changes in commercial bank adjusted holdings of loans, leases and securities, with cash assets excluded. Notice that prior to 2009, the year-over-year percent changes in the two series in Chart 1 moved in close tandem with numerical values also very close, suggesting that the behavior of bank credit dominated the behavior of the sum of bank credit and Fed credit. With the onset of the financial crisis in late 2008, credit created by commercial banks, i.e., loans, leases and securities, contracted. With the extraordinary extension of Fed credit through the discount window and other facilities and the implementation of Fed outright securities purchases (QEI), a large increase in cash assets at commercial banks partially offset the declines in bank credit, keeping the year-over-year changes in the sum of bank credit and Fed credit positive through September 2009, albeit at a diminishing rate of growth. From October 2009 until early 2011, the year-over-year changes in the sum of bank credit and Fed credit were consistently negative as Fed discount window loans were repaid, QEI was gradually terminated and bank credit continued to contract.
QEIII was initiated in the fourth quarter of 2012 as year-over-year growth in bank credit was slowing. Early in 2014, the Fed began its tapering its QEIII securities purchases. At the same time, year-over-year growth in bank credit picked up and has continued to do so throughout 2014. So, despite the slowdown in growth of Fed thin-air credit, i.e., commercial bank cash assets, with the recent pick up in bank thin-air credit creation, the sum of commercial bank thin-air credit and Fed thin-air credit, is now growing year-over-year at its fastest pace since December 2005.
So, what does this have to do with inflation? Why do I assert that the seeds of U.S. inflation have sprouted? Well, U.S. asset prices have risen rather significantly. This is shown in Chart 2 in which I have charted the holding gains on U.S. household assets – direct and indirect holdings of financial assets and real estate – as a percent of nominal Gross Domestic Purchases (nominal dollar expenditures by U.S. households, businesses and governments on currently-produced goods and services). To smooth the data, I have presented the four-quarter moving average of this ratio.
Chart 2

In the four quarters ended Q1:2014, the latest data available, holding gains of U.S. household assets in relation to nominal Gross Domestic Purchases averaged 9.4%. Holding gains of this magnitude are closing in those experienced during the NASDAQ bubble of the late 1990s and the housing bubble of the mid 2000s. So, asset-price inflation is occurring currently. Hence, my assertion that that the seeds of U.S. inflation have sprouted.
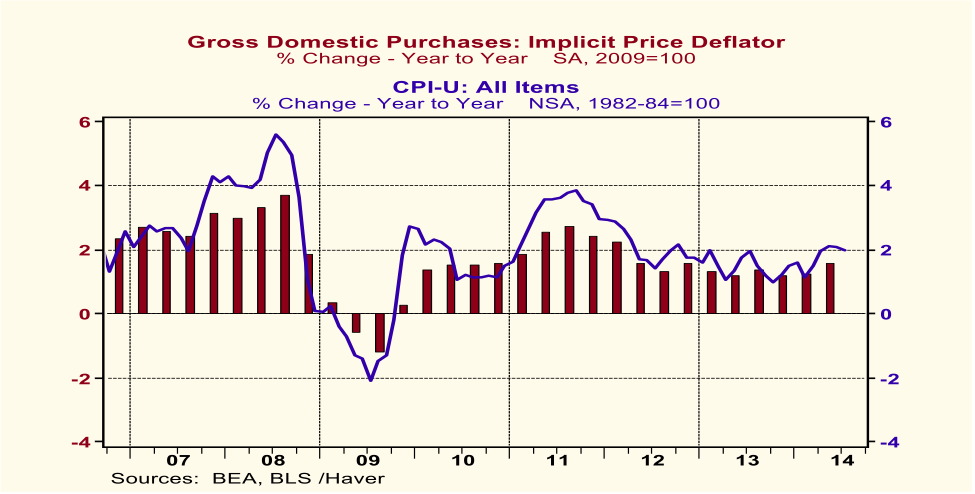
But what about my prediction that U.S. inflation could be in full flower in 2016? The goods/services price data shown in Chart 3 do not indicate any similar current breakout in this kind of inflation as compared with the current breakout in asset-price inflation.
Chart 3
But might there be a breakout in goods/services price inflation in 2016? The historical relationship between thin-air credit growth and goods/services price inflation suggests as much. In the post-WWII era, the gestation period of goods/services price inflation relative to thin-air credit growth has tended to be long – about two years. So, what is happening to thin-air credit today will have its effect on goods/service price inflation in about two years from now, based on historical relationships. My data analysis indicates that in the past 60 years, the highest correlation between the year-over-year percent change in the implicit price deflator of Gross Domestic Purchases and the year-over-year percent change in thin-air credit (i.e., the sum of Fed and depository institution credit) is 0.55 out of maximum possible 1.00, which is obtained when thin-air credit leads the implicit deflator by ninequarters. This result is shown in Chart 4.
Chart 4
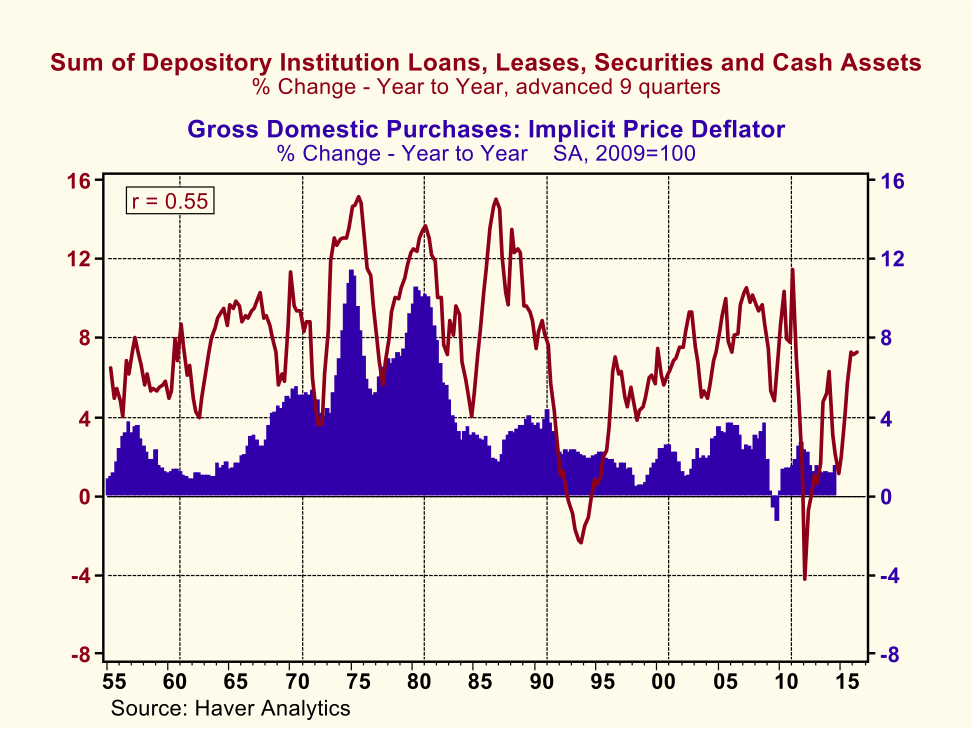
Whether the behavior of thin-air credit leads the behavior of goods/services price inflation by nine quarters or five quarters, the point is that it does lead and the lead time is relatively long. Thin-air credit currently is growing and has been growing for about a year at an historically rapid rate. Thus, one should not be sanguine about the prospects for continued mild goods/services price inflation just because this inflation currently is mild.
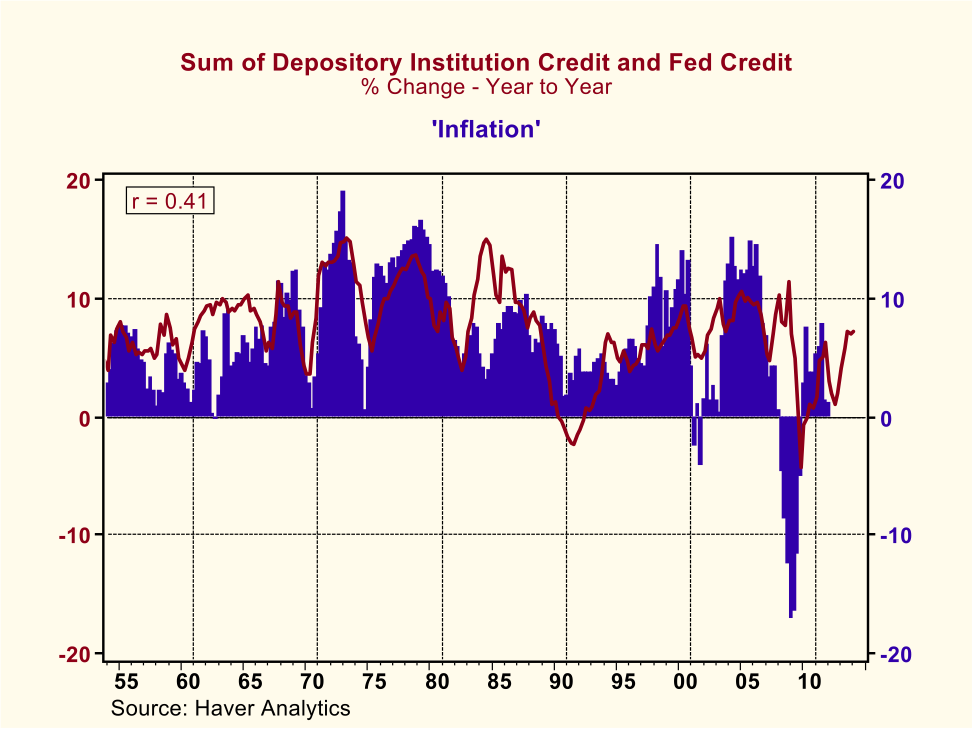
I said at the outset that my definition of inflation includes both the behavior of goods/services prices and asset prices. I also said at the outset that I believed that thisinclusive concept of inflation resulted from monetary factors. Chart 5 shows the historical relationship between percentage changes in thin-air credit and my inclusive definition of inflation. (I wish the statistics gurus at the BLS, Commerce or the Fed would calculate a price index that included both goods/services prices and asset prices. But, given that no such index exists to the best of my knowledge, I have had to construct my own, crude as it is.) To construct my inflation measure, I have added together the four-quarter moving average of household asset holding gains as a percent of nominal Gross Domestic Purchases and the year-over-year percent change in the implicit price deflator of Gross Domestic Purchases. To account for historical lead-lag relationships, the percentage change in the implicit price deflator is lagged by nine quarters while the holding gains measure of asset-price inflation is contemporaneous. For example, the last “inflation” data point plotted in Chart 5 is for Q4:2011, which is the sum of the year-over-year percent change in the Gross Domestic Purchases implicit price deflator for Q1:2014 (remember, it is lagged by ninequarters) and the four-quarter moving average of household asset holding gains as a percent of nominal Gross Domestic Purchases for Q4:2011. Whew! The correlation between thin-air credit growth and “inflation” is 0.41. Although I typically do not get too excited about correlations below 0.50, given the crude nature of my “inflation” variable with one component measured contemporaneously and one component measured with a nine-quarter lag, a correlation of 0.41 is better than a poke in the eye with a stick. Moreover, the chart looks pretty good, save for 1984, which might reflect the oil glut of 1986 (remember, the implicit deflator change is lagged by nine quarters) and 2008, when thin-air credit soared as the Fed opened up the discount window and created other lending facilities to satisfy an increased demand for liquidity in the wake of financial institution solvency issues.
Chart 5
To summarize, as of July, the sum of commercial bank credit and Fed credit had increased 9.7 percent year-over-year despite a sharp slowing in Fed credit growth due to the winding down of QEIII. Growth in thin-air credit of this magnitude is high in an historical context. Persistent growth in thin-air credit of this magnitude typically results in rising inflation – asset-price inflation and/or goods/services-price inflation. The U.S. already is experiencing asset-price inflation. Given its historically long gestation period, a sharp acceleration in goods/services-price inflation is likely to be evident in 2016. Unless growth in commercial bank credit autonomously decelerates and/or the Fed soon takes more aggressive actions to restrain growth in the sum of bank and Fed credit, higher inflation, in the inclusive sense, will be “baked in the cake” over the next couple of years.
One final note. In addition to saying that inflation is a monetary phenomenon, Professor Milton Friedman also said that the lags between monetary variables and inflation are long and variable. Based on my empirical analysis, I agree with his conclusion regarding the long and variable lags. As a result of his analysis, Professor Friedman recommended 60 years ago that Fed policy be conducted so as produce a steady rate of growth in the quantity of some monetary variable. By so doing, the Fed could avoid unintentionally increasing the amplitude of inflationary cycles. Although I may humbly disagree with Professor Friedman’s choice of the monetary variable quantity whose growth rate the Fed should target, 60 years later I still agree with his premise. I believe that if the Fed were to operate such that thin-air credit grew at a steady and “reasonable” rate (its 61-year median growth rate is 7.4%), then the high goods/services-price inflations of the Burns-Fed era and the high asset-price inflations of the Greenspan-Fed era could be avoided. And by avoiding these extreme inflations in the future, we could avoid the extreme recessions in real output that inevitably ensue once the inflation “fevers” break.
Source: Paul L. Kasriel, The Econtrarian

What's been said:
Discussions found on the web: