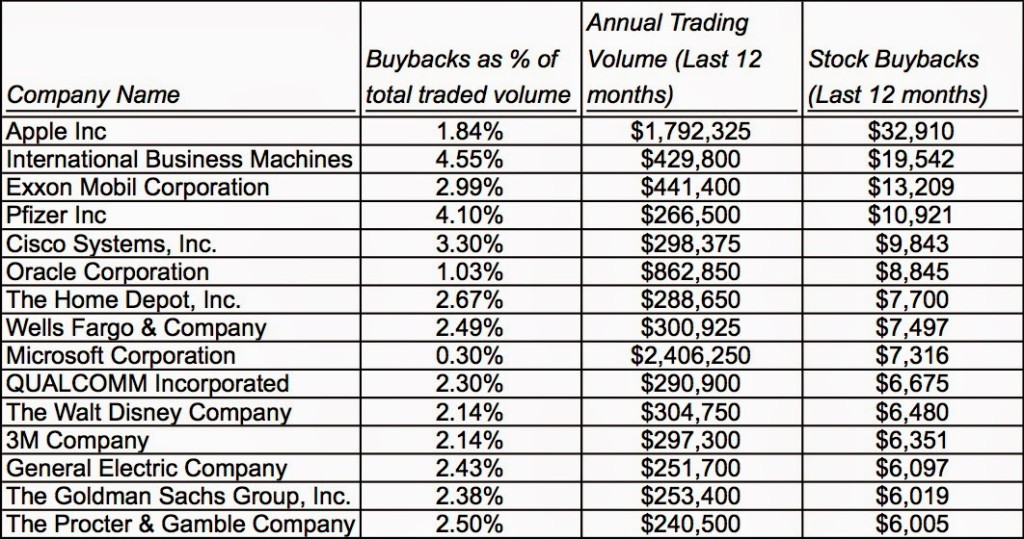
Today’s chart comes from a very interesting article on stock buybacks from Aswath Damodaran, a professor at New York University.
He writes:
This has been a big year for stock buybacks, continuing a return to a trend that started more than two decades ago and was broken only briefly by the crisis in 2008.
The thing to note about buybacks is how greatly exaggerated their impact may be. As evidence, Damodaran points out two recent stories: one in the Economist and one in the Wall Street Journal.
And here’s the chart:

Source: Aswath Damodaran
Ultimately, buybacks return cash to shareholders. In terms of earnings, the impact of buybacks is somewhat more complex.
It’s best to think of buybacks in a broader context and not simply as a reduction in share count.
According to Damodaran:
The problem is that a buyback alters the risk profile of a firm and should also change its PE ratio (usually to a lower number).
Before a company calls for a stock buyback, it has risky assets (its operating business) and riskless assets (cash). After the buyback, the company has less of its riskless asset (cash) but also has fewer outstanding shares.
Hence, we end up with a somewhat riskier stock. Damodaran argues, rationally, that a buyback by an all-equity funded company should be a value-neutral transaction. In other cases, the shift should be reflected in by assigning the company a somewhat lower price-earnings ratio.


What's been said:
Discussions found on the web: