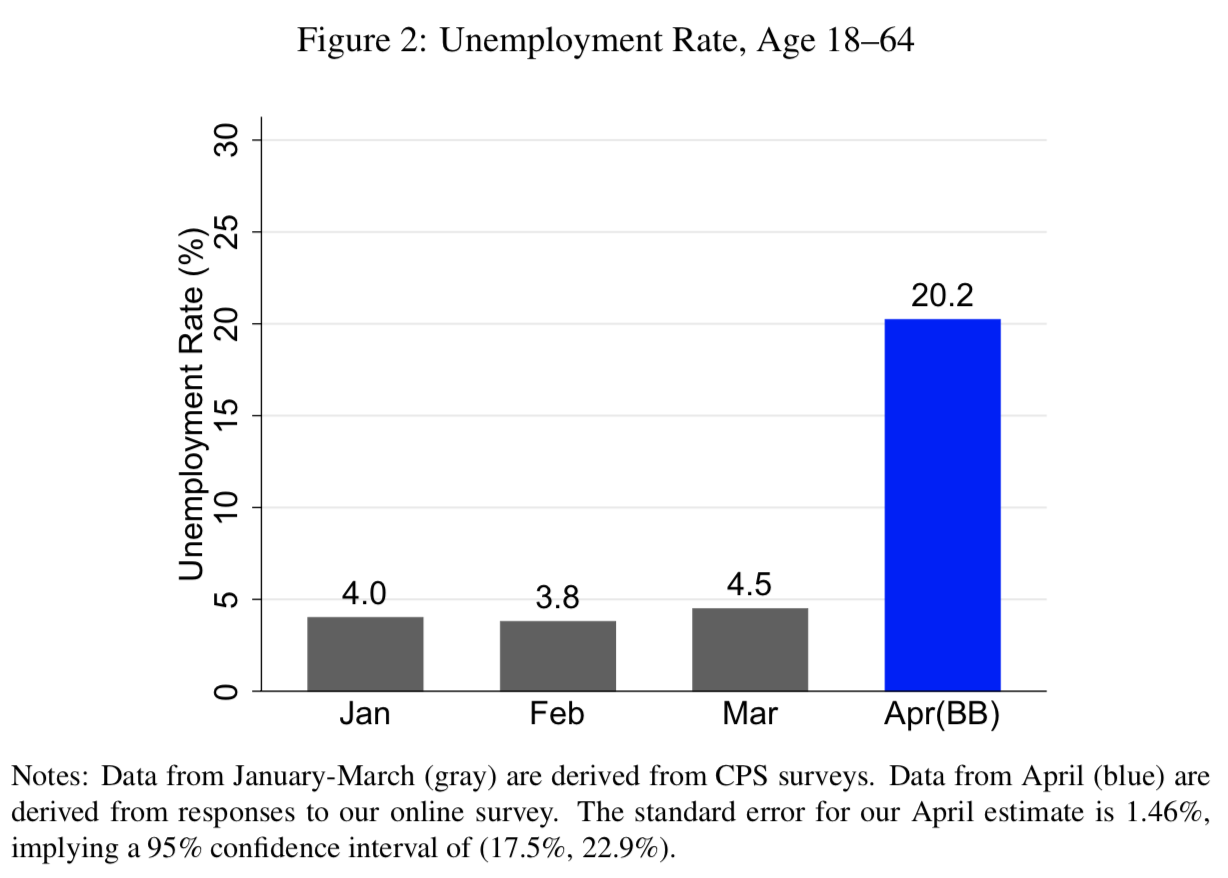
3.2 The Unemployment Rate
Source: Alexander Bick
Fascinating idea: Currently, we get a single Employment Situation report from BLS once a month. What if that data were updated more frequently? 2X a month, weekly, daily and eventually continuously?
That is on the minds of researchers who created the chart above. They designed a survey questionnaire to closely parallel the one used by BLS.
Here are their major findings for the last week of March:
1. Dramatic reductions in employment.
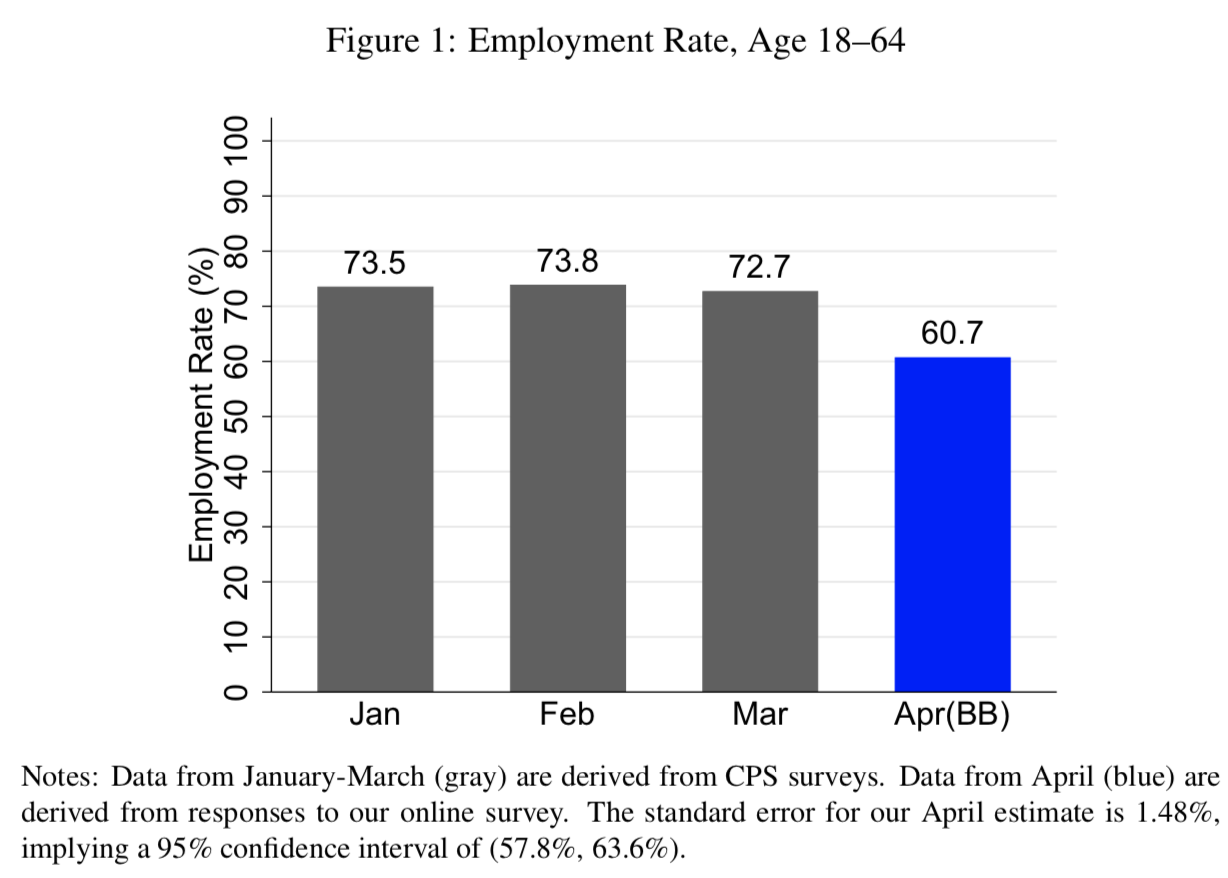
(a) We find an employment rate of 60.7% during the first week of April, compared with 2.7% in the second week of March, implying 24 million fewer workers.
(b) We find an unemployment rate of 20.2% during the first week of April, compared with 4.5% in the second week of March. One positive note is that over half of the unemployed reported being temporarily laid off, suggesting that many could return to work quickly if conditions improve.2. Even larger declines in aggregate labor supply then implied by employment alone.
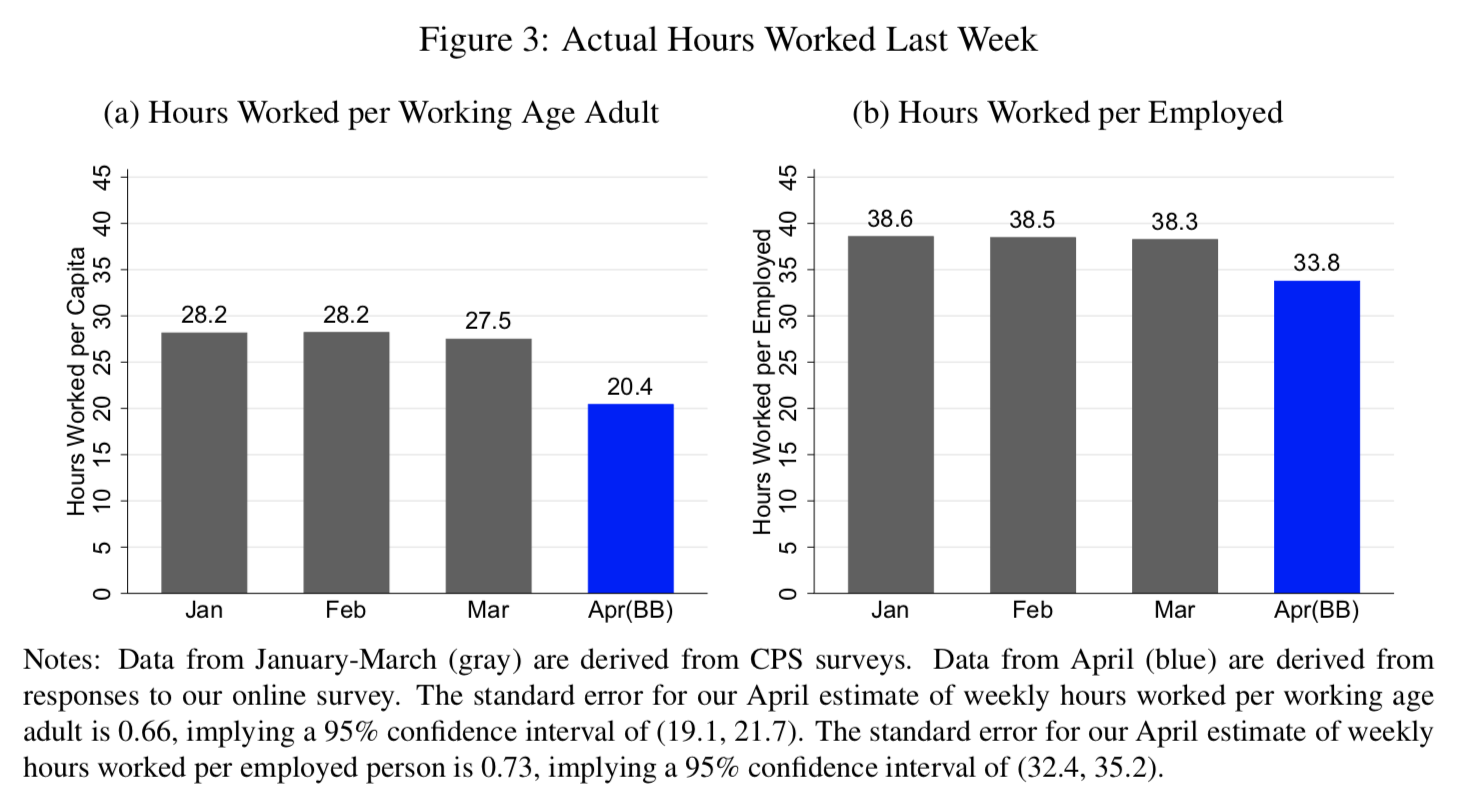
(a) Hours worked per working age adult declined 25% from March. In the first week of April, individuals worked 20.4 hours on average, compared with 27.5 weekly hours in the second week of March.
(b) Hours worked per employed declined 12% from March. Even those who are still employed are working 4.5 fewer hours per week, a reduction of over half a day of work. This implies that just under half of the decline in hours per working age adult were due to reductions in hours worked per employed, and are therefore not reflected in changes to the employment rate.3. Unprecedented increase of the share of hours worked from home.
(a) We find that 63.8% of work hours were from home during the first week of April, compared with roughly 10% in the Spring of 2017 and 2018.4. Lower earnings even for individuals still working the same job as in February.
(a) We find that 21.9% of workers still working the same job as in February experi- enced a reduction in their earnings last week compared to February. About half of these reported that their reduction in earnings was 50% or larger.
(b) At the same time, 11% of workers with the same job as in February report higher weekly earnings last week compared with February.5. Disparities in labor market outcomes by sex, age, education, race, and hourly status.
(a) Although negative effects are widespread, they are more pronounced among workers who are female, older, and less educated.
UPDATE: April 22 2020
• America Needs Real-Time Economic Data to Get Through This Crisis (Businessweek)
Previously:
Report Earnings Daily (August 27, 2018)
Source:
Real Time Labor Market Estimates During the 2020 Coronavirus Outbreak
Alexander Bick, Arizona State University; Adam Blandin, Virginia Commonwealth University
April 15, 2020
https://alexbick.weebly.com/uploads/1/0/1/3/101306056/bb_covid.pdf
3.1 The Employment Rate
Source: Alexander Bick
3.3 Hours Worked per Working Age Adult