Let’s talk real estate.
I am a magnet for residential real estate questions. Having more or less gotten the 2000s RRE mess right, I get regular questions about real estate investments, pricing, cycles, and values. I don’t always know the answer, but can usually find the person who does.
This current housing market is unusually confusing, for lots of reasons, but let’s reference a few of them.
Start with the undersupply of single-family homes. We discussed this in detail last Summer. The tl:dr is that heading into the pandemic, we had a decade of reduced demand and underbuilding, a huge lag in household formation, building up to lots of pent-up demand.
Add to this mortgage costs were the cheapest in modern times.
Third, the pandemic disrupted the usual chain of sales. Normally, this looks something like this: First-time buyers buy a home from a growing family – one kid, another on the way, needs more space. They in turn purchase from the “move up” family, who buy into a nicer neighborhood, whose seller moves into an even more luxurious home, who buy from the person moving to waterfront/lakeside/mountain views, who buy from the soon to be retired. What is notable is that the total number of homeowners remains the same as each purchase leads to a sale.
That didn’t happen this time around; people stuck in apartments or too small homes purchased second (or third) homes without selling anything. It only takes a few quarters of this activity to suck up most of the available supply.
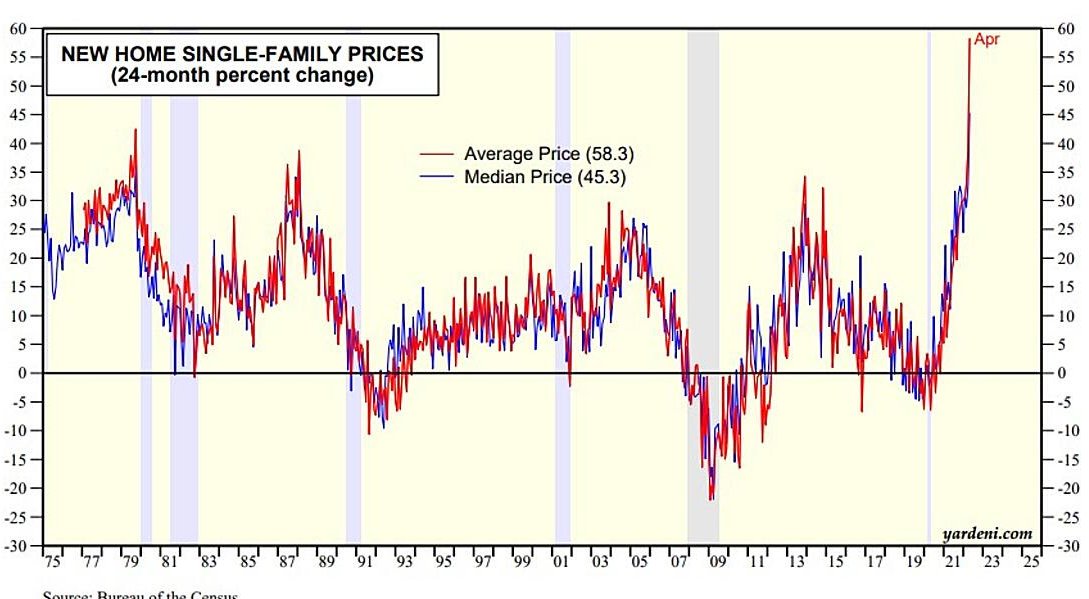
In a very short time, these three factors – a decade of underbuilding, historic low rates, and a disruption of the sale chain – led to the unusual circumstance of high demand and low supply. Prices have spiked as you can see in the chart above (via Yardeni Research). Or, consider these annual gains (via Charlie Bilello):
Average price of a new home in the US…
2012: 288k
2013: 337k
2104: 325k
2015: 340k
2016: 369k
2017: 366k
2018: 385k
2019: 385k
2020: 360k
2021: 435k (+21% YoY)
2022: 570k (+31% YoY)— Charlie Bilello (@charliebilello) May 24, 2022
Where things get interesting is how homeowners and sellers have responded to these circumstances. There have been bidding wars for the reasonably-priced homes, and in response, some sellers have put up their homes for sale at extremely high and unlikely-to-sell prices at least judging the marketplace relative to immediately prior comparable sales or simply how long they take to sell relative to average time on the market. My friend Jonathan Miller coined the term “Aspirational Pricing” to describe this approach to listing homes for sale.
Consider a favorite Zillow trick to see what this looks like. Pull up a map of your favorite locale; you can do this by typing the name of a town into the search box or by using the draw tool to encircle a given region. Now sort this by newest listing. Zillow doesn’t allow you to reverse this, so instead you have to scroll to the bottom.
Despite this being the hottest housing market in recent memory, you can find homes that have been for sale for 500, 1000 even 1500 days. And if you check the price history, you can see homes that have been listed on and off by the same seller for years and years and years.
I show a few examples of this here, but you can do the same thing with the app or website on your own.
Sale prices contain market information; listing prices are revealing about psychology…
Previously:
Residential Real Estate in a Volatile World (March 30, 2022)
How Everybody Miscalculated Housing Demand (July 29, 2021)
Mansions Don’t Produce Much Alpha (December 2, 2016)


