“The sharp rise in interest rates has sent shockwaves through markets. The S&P 500 Index has steadily declined ~20% year-to-date, and the NASDAQ Composite Index has fallen ~30%. Bond markets are also showing signs of uncertainty, with the 10-year minus 2-year Treasury yield curve acting as a prime example. This yield curve subtracts the return on short-term government bonds from long-term government bonds.”
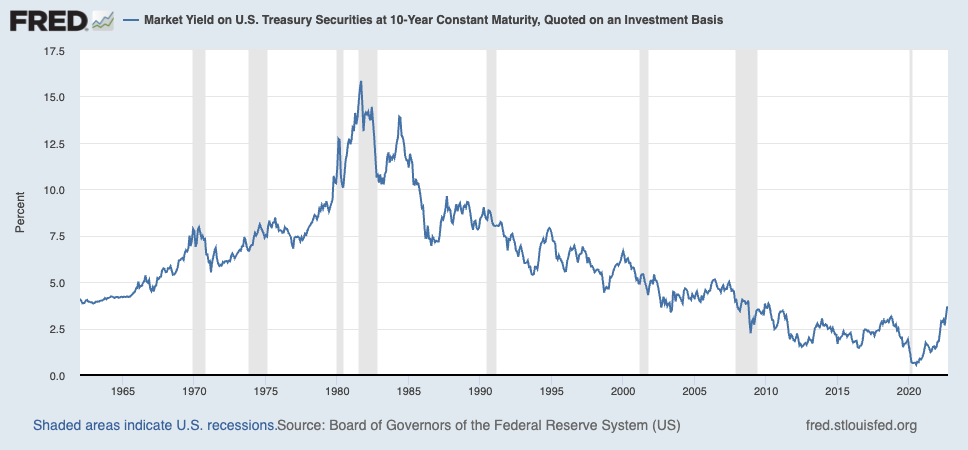
Here is what interest rates looked like on the 10-year bond since 1962: