
A comprehensive look at CO2 emissions around the world and their specific sources:
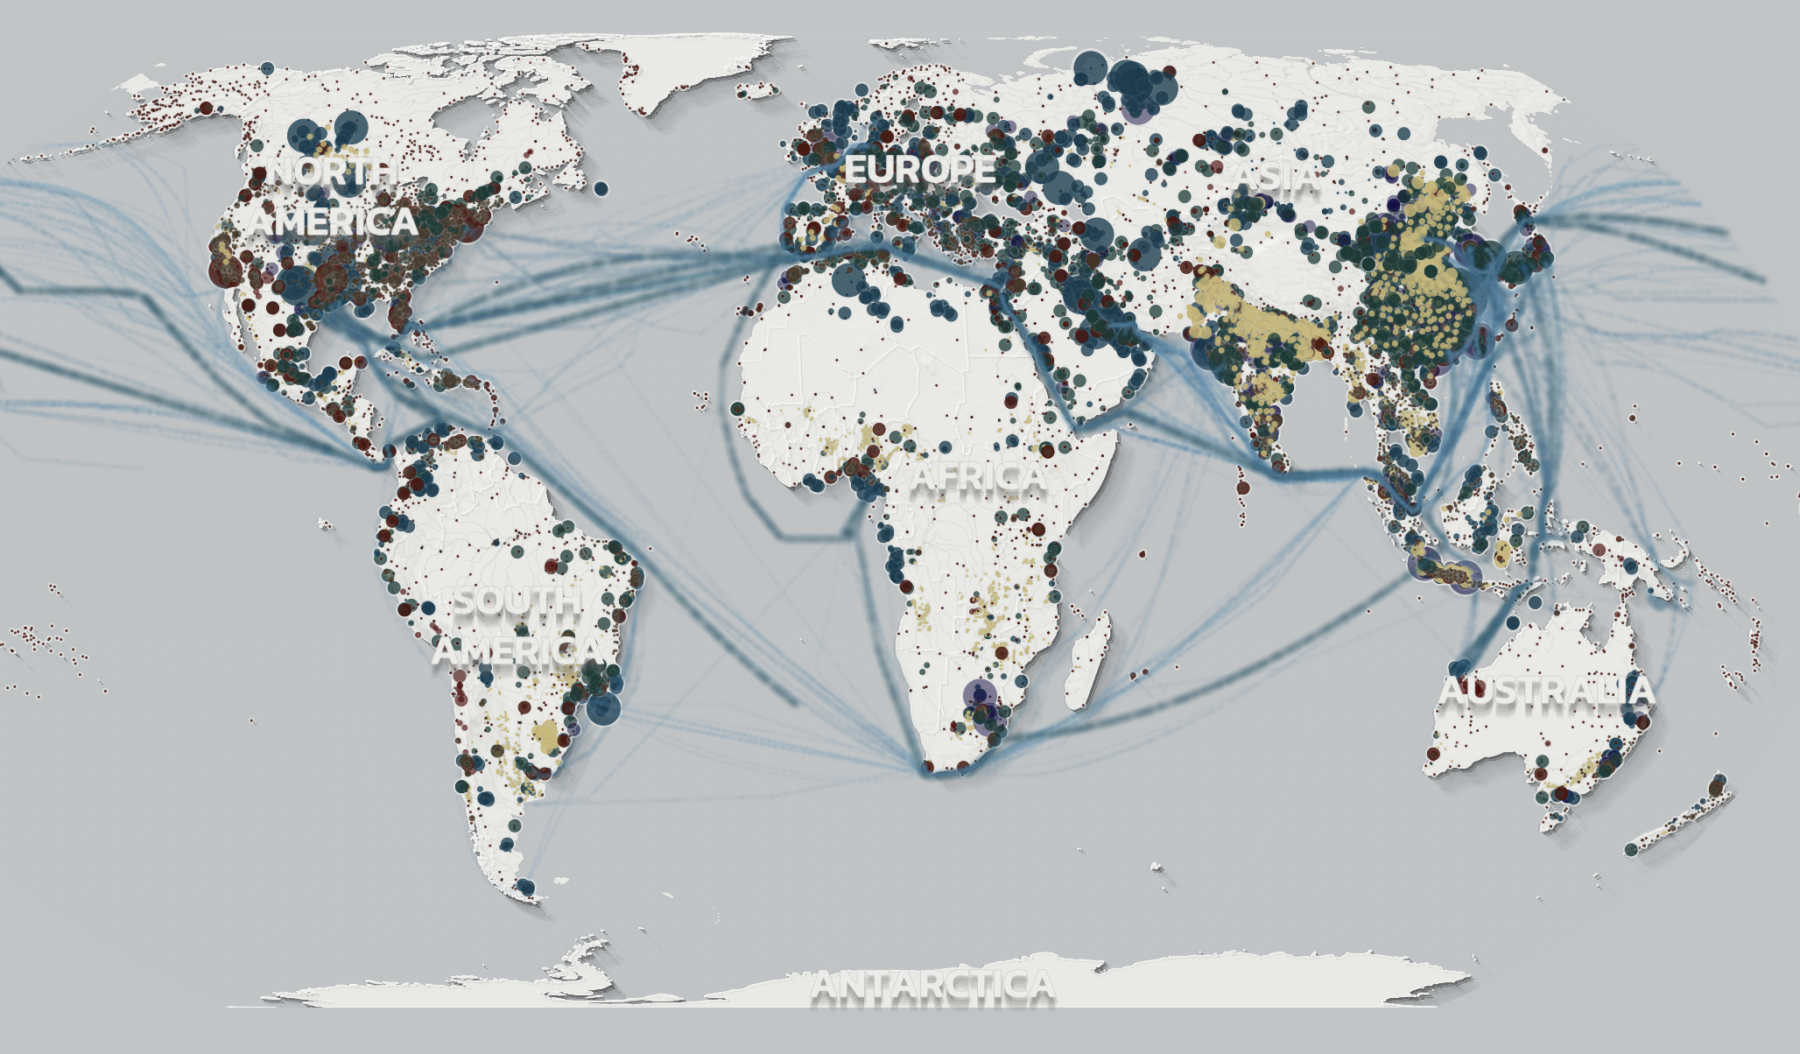
“Today, the Climate TRACE coalition released the most detailed facility-level global inventory of greenhouse gas (GHG) emissions to date, including emissions data for 72,612 individual sources worldwide. The 70,000+ individual sites — including specific power plants, steel mills, urban road networks, and oil and gas fields — represent the top known sources of emissions in the power sector, oil and gas production and refining, shipping, aviation, mining, waste, agriculture, road transportation, and the production of steel, cement, and aluminum.”
If this is the sort of data dive that interests you, it’s a rabbit hole you can get lost in.
—Half of the 50 largest sources of emissions are oil and gas production fields and their associated facilities.
—The top 500 sources represent less than 1% of the total Climate TRACE inventory but account for 14% of global emissions for 2021 – more than the annual emissions of the United States.
—Globally, emissions from oil and gas production are significantly underreported, with Climate TRACE data showing that of the countries required to report regularly to the UNFCCC, emissions are as much as three times higher.
—Climate TRACE’s comprehensive country-by-country data — now updated to include 2021 annual information — provides timely emissions inventories for every party to the Paris Agreement.
