
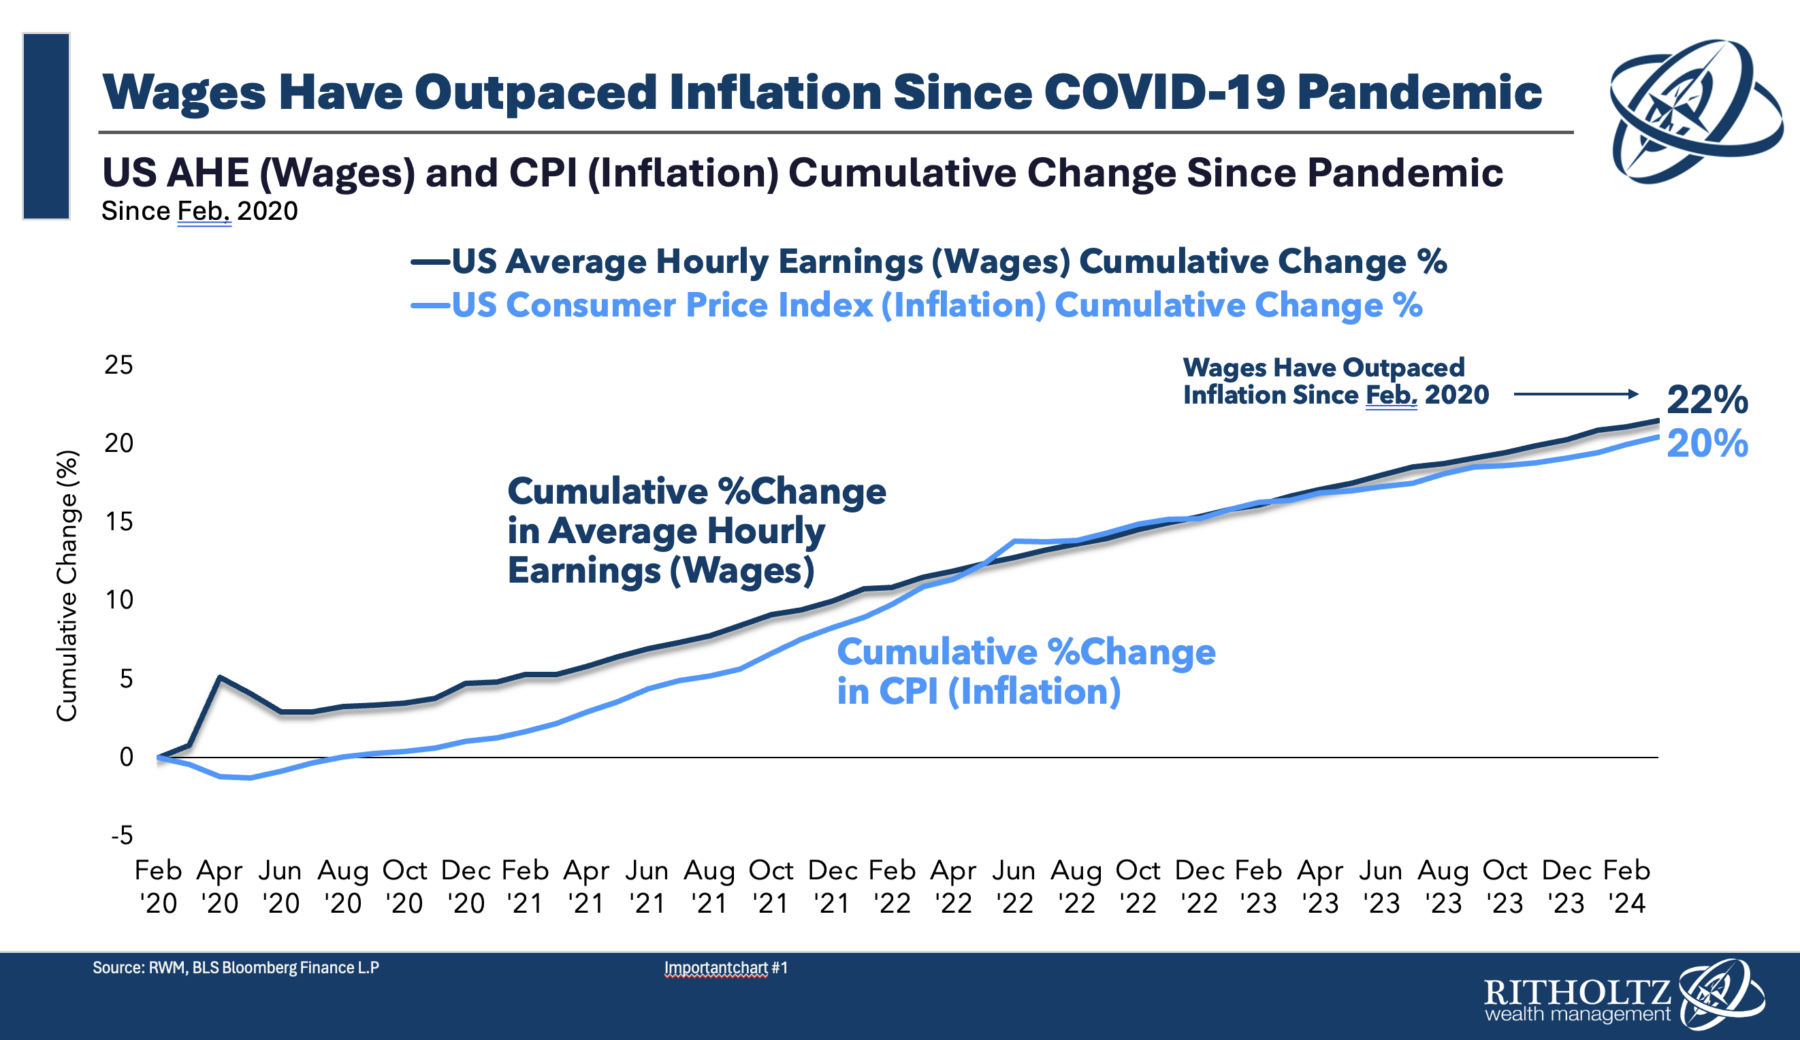
Putting the final touches on my quarterly RWM client call, I wanted to share a chart that is surprising to many people. The above shows changes in the BLS Average Hourly Earnings and Consumer Price Index since the Pandemic blew up in February 2020.
What seems to surprise people: On average, U.S. wages have outpaced inflation since 2020.1
What are the key drivers here? Two big things stand out:
Fiscal Stimulus: At nearly $2 trillion, CARES Act I was the largest fiscal spend as a percentage of GDP (about 10%) since World War Two. CARES Act II was another $800 billion; CARES Act III was nearly 1.8 trillion (I and II under Trump, III under Biden).
These dumped a ton of cash into the economy all at once in 2020 and 2021. CPI inflation peaked in June 2022, as most of the pig was through the python by then.
Shrunken Labor Force: There are many factors driving unemployment down to 3.8%, the lowest since the 1960s, but I see 3 major elements:
1. Reduced Immigration during both Trump & Biden Administrations; Under Trump, legal immigration fell around 1 million people each year; that continued under Biden during the pandemic years of 2021 and first half of 2022. It has since rebounded in 2H ’22, 2023, and 2024;
2. COVID deaths in the United States were a factor, as we had more than 2 million COVID-related deaths; while age was a morbidity co-factor, many of the people who died were in what BLS defines as “Working Age” (16-64);
3. Disability inlcudes a variety of elements (Addiction, Illness, Injury, Long Covid, etc.) but for the last 15 years it has been gradually rising until COVID, then it spiked. For women, disability was flat until Covid, then it picked up dramatically.
The basic maths is a shortage of qualified workers (or even bodies to put to work) equals rising wages.
Many other factors exist, but I suspect these two are the most significant…
Previously:
Which is Worse: Inflation or Unemployment? (November 21, 2022)
A Dozen Contrarian Thoughts About Inflation (July 13, 2023)
Who Is to Blame for Inflation, 1-15 (June 28, 2022)
__________
1. This is the average, and there is a longer discussion to be had about how that breaks down by quartiles or deciles, but I will save that post for a future date.
