In an earlier post titled “CDS rates, What Is The Thermometer Telling Us?” we said:
Sovereign default rates are moving higher across the globe. It underscores a concept we detailed in a recent Commentary and Conference Call, namely the credit crisis was never solved. It was transformed from a reckless private sector borrowing binge to a reckless public sector borrowing binge.
Let us explain:
In the wake of the credit crisis we often talk of deleveraging. But how much has really taken place? The latest Flow of Funds data can help shed some light on this.
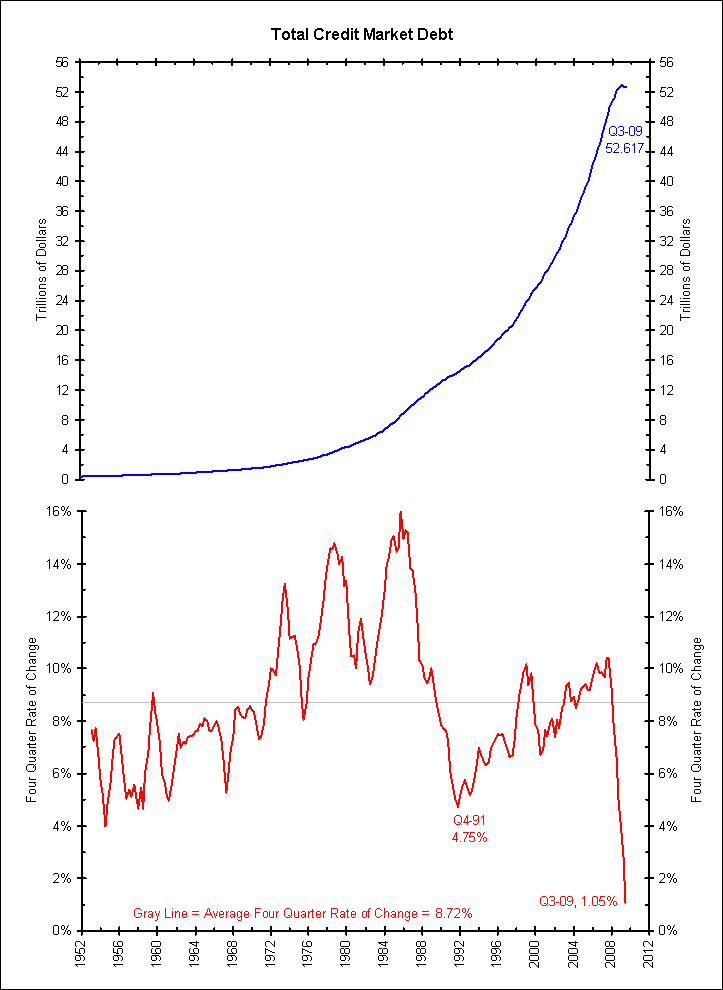
The first chart shows total credit market debt in blue on the top and its four-quarter rate of change below. As of Q3 2009, total debt stood at $52.617 trillion, growing 1.05% from one year earlier.
<Click on chart for larger image>
Deleveraging requires negative debt growth. Since the chart above shows total debt growth of 1.05% over the last year, this is not deleveraging. To be fair, it is the lowest growth since this series began in 1952, but it shows no sign of deleveraging.
Breaking down the series above, the next chart shows private credit market debt in the same format. Private credit is the total credit measure shown above minus Treasury, municipal, agency (including GSE-guaranteed MBS) and foreign debt.
<Click on chart for larger image>
This chart shows that the private sector is deleveraging. The total level of private sector debt is 3.80% lower than a year ago and negative for the first time since this series started in 1952.
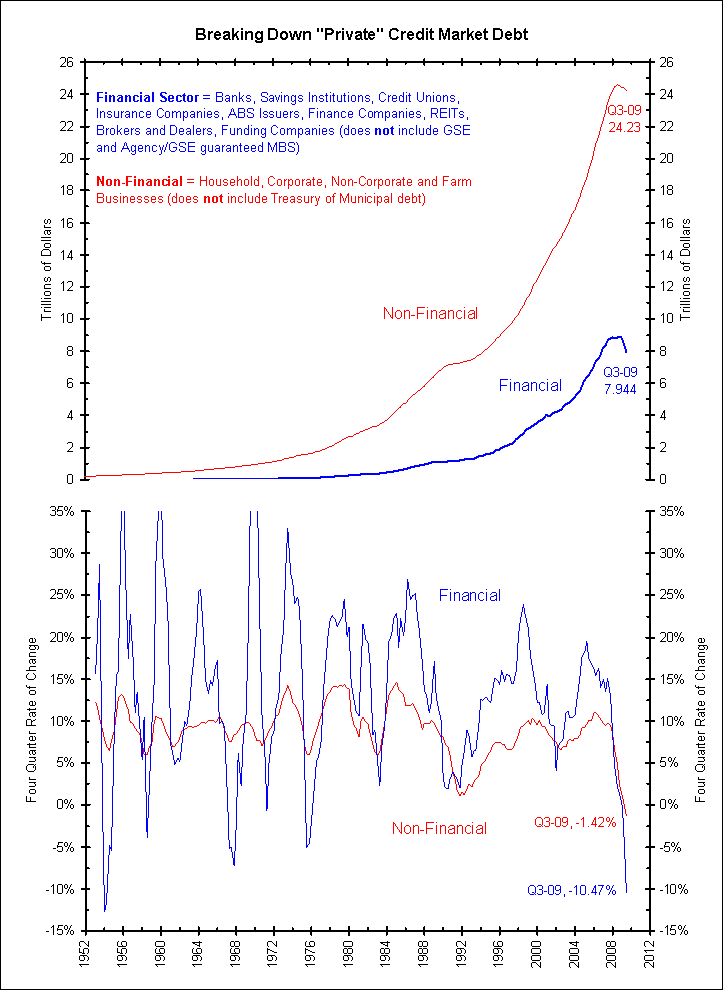
The next chart further breaks down private sector debt, showing financial and non-financial private debt. We find that virtually all the private sector deleveraging comes from the financial sector (blue lines), down 10.47% in the last year. The non-financial sector (red lines), which has borrowed more than 3 times times the financial sector, has barely deleveraged, down only 1.42% in the last year.
<Click on chart for larger image>
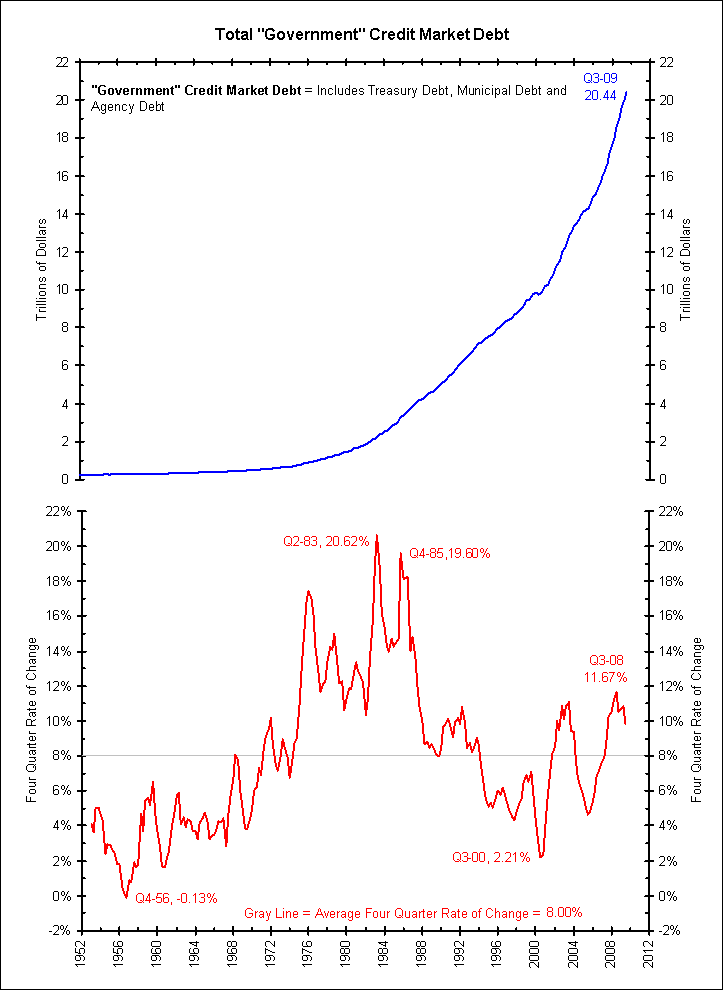
The final chart below shows total government debt. This includes Treasury, agency (including GSE-guaranteed MBS) and municipal debt. It is booming and currently stands 9.81% higher than it did 1 year ago. During the height of the crisis, Q3 2008, government debt levels were booming ahead at an 11.57% pace, a 20-year high. This is the opposite of deleveraging.
<Click on chart for larger image>
Conclusion
The “Great Recession” has essentially only resulted in deleveraging of the financial sector. The overall levels of debt are still rising, thanks to a very modest deleveraging of the non-financial sector and a big releveraging of the government sector.
Was the only problem that the financial sector was too leveraged? If so, the Great Recession returned the markets to sane debt levels. If not, then the government releveraging has prevented the correction and deleveraging needed to put the credit crisis firmly behind us. We fear the latter may be closer to the truth and the credit crisis is only partially complete. The next major deleveraging will occur in the government sector.
Is this what widening sovereign CDS rates are telling us?


What's been said:
Discussions found on the web: